pgdatagraph
 pgdatagraph copied to clipboard
Interactive widget for graphing time-series data - based on D3 and Rickshaw.
pgdatagraph
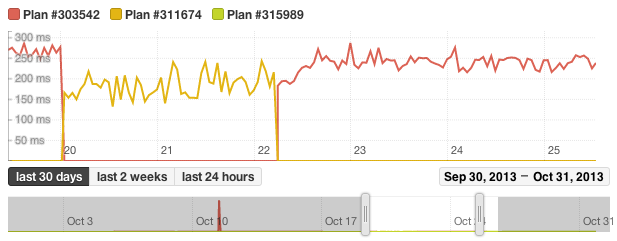
Interactive widget for graphing time-series data - based on D3 and Rickshaw.
Note that the repository is structured as a Ruby gem. If you don't use this as a library inside a Ruby project just copy the code from app/assets to your project directory.
Example Use
The following Javascript renders a datagraph into the #cpu_graph element
new PG.DataGraph("#cpu_graph.datagraph", "https://yourapp.com/data/cpu_graph");
The server should return a JSON time series on GET, structured like this and sorted chronologically:
callbackFunction({"Label 1":[[1383257416,0.95],[1383258014,0.96]], "Label 2":[[1383257416,8.77],[1383258014,0.0]]})
There is three GET parameters we send:
callback: Name of the callback functionstart: Requested start timestamp (UNIX timestamp)end: Requested end timestamp (UNIX timestamp)
Authors
- Philipp Markovics
- Lukas Fittl
License
Copyright (c) 2013-2014 pganalyze
pgdatagraph is licensed under the 3-clause BSD license, see LICENSE file for details.