uPlot
 uPlot copied to clipboard
📈 A small, fast chart for time series, lines, areas, ohlc & bars

Currently, when I scale my x-axis only by dragging, my y-scale becomes invalid (essentially disappears). In my options I have ```javascript cursor: { drag: { x: true, y: true, dist:...
I have some plugins to do pan and mousewheel scroll adapted heavily from your examples. What I would like to do is get the calculated plot extents of all visible...
`uPlot.Scatter` e.g. https://academy.datawrapper.de/article/65-how-to-create-a-scatter-plot spatial index via e.g. https://github.com/mourner/kdbush or https://github.com/mourner/flatbush data format e.g.: ```js [ [x,y,v,l,x,y,v,l], // series 1 [x,y,v,l,x,y,v,l], // series 2 [x,y,v,l,x,y,v,l], // series 3 ] ``` -...
Hi, is there any way to set a custom null legend value for a series? If the mouse is not hovering over the chart, the legend shows `--` which, as...
currently stacked [1] and shifted [2] demos have to pre-stack the raw data, which means `u.data` no longer contains raw values and hooks/plugins cannot read this back for display and...
Example demo page: https://leeoniya.github.io/uPlot/demos/nice-scale.html Zoom in a domain where there are no more data points: 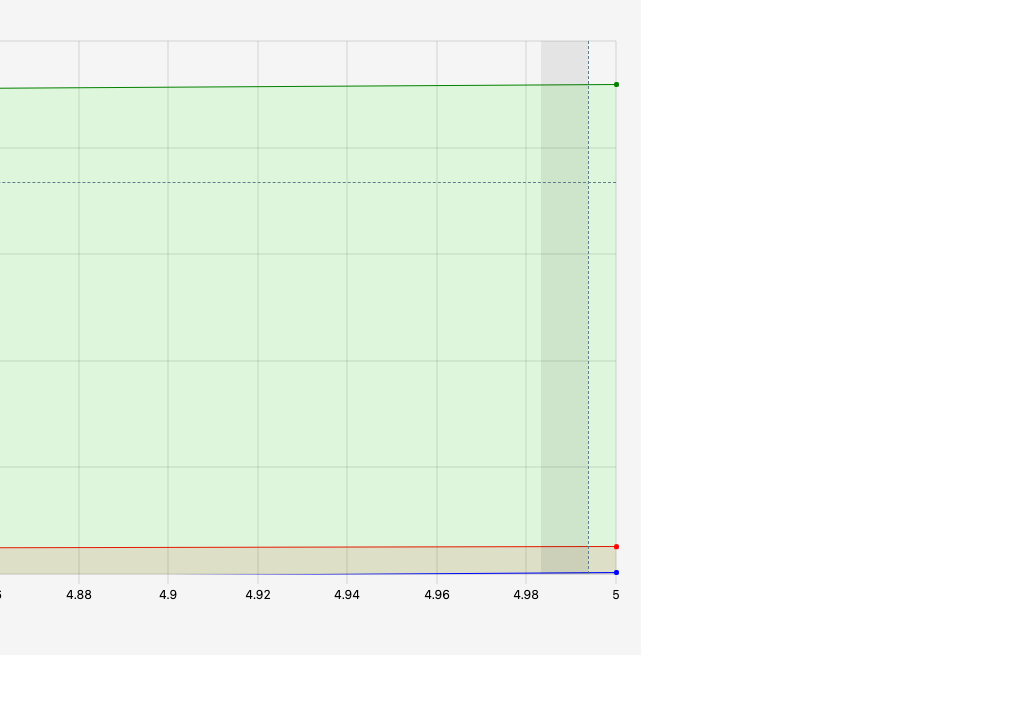 -- _PS: Many thanks for uPlot. I am a...
Hi there! I went through your code on multi-series bars. I'm not sure how I can add line series on top of using the seriesBarsPlugin. Can I combine/mix multi-series bars...
not quite sure if this is a net positive or not, but drawing crisp bars with canvas-native strokes is a real pain in the ass with a lot of accidental...
**uPlot version**: 1.6.17 **Browser**: Chrome 95.0.4638.69 **OS**: macOS **Bug description**: If you set scale range to equal numbers like [1,1], [2,2] and etc.. except [0,0] memory usage skyrockets and tab...
I want to customize the y-axis and make bold points on the y-axis based on min/max values of specific series when hover on the specific series. want to highlight below-mentioned...