uPlot
 uPlot copied to clipboard
Custom Legend
Thanks for developing this amazing library!
I have the need for an interactive legend and would like to know if you have some ideas how I could customise the existing legend.
-
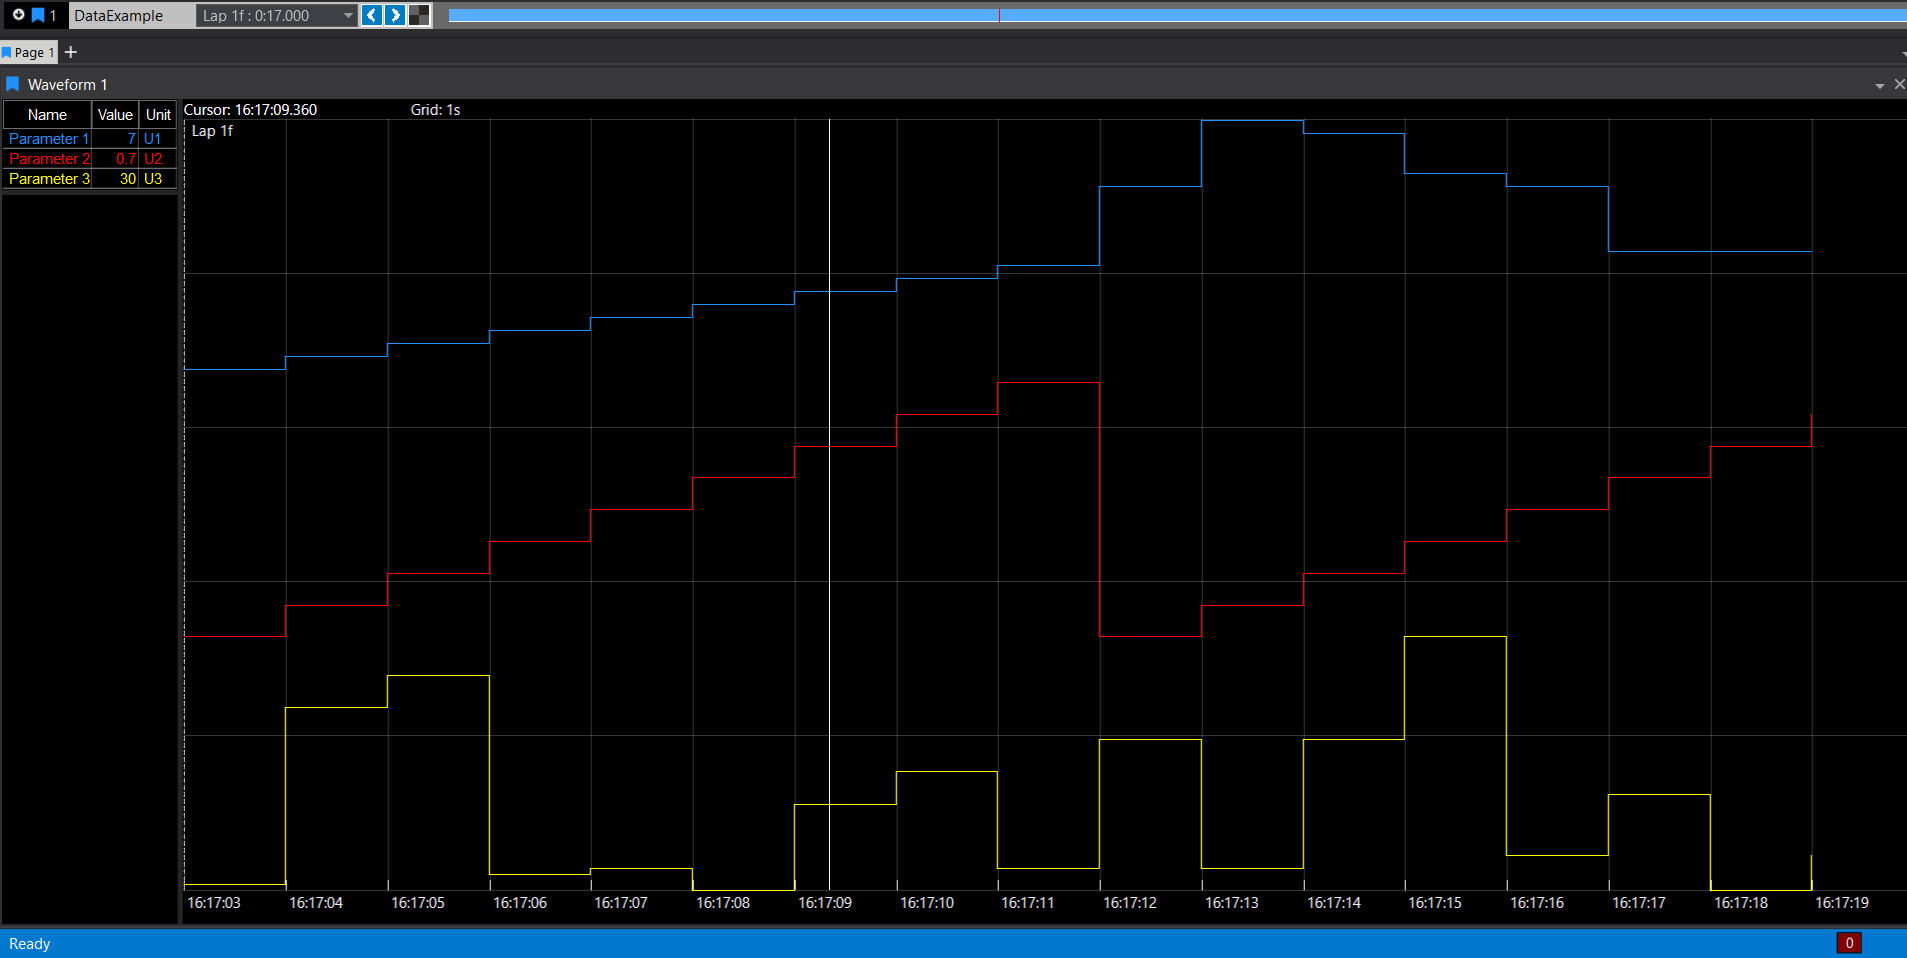
The legend needs to be on the left side for my use case, similar as this example:
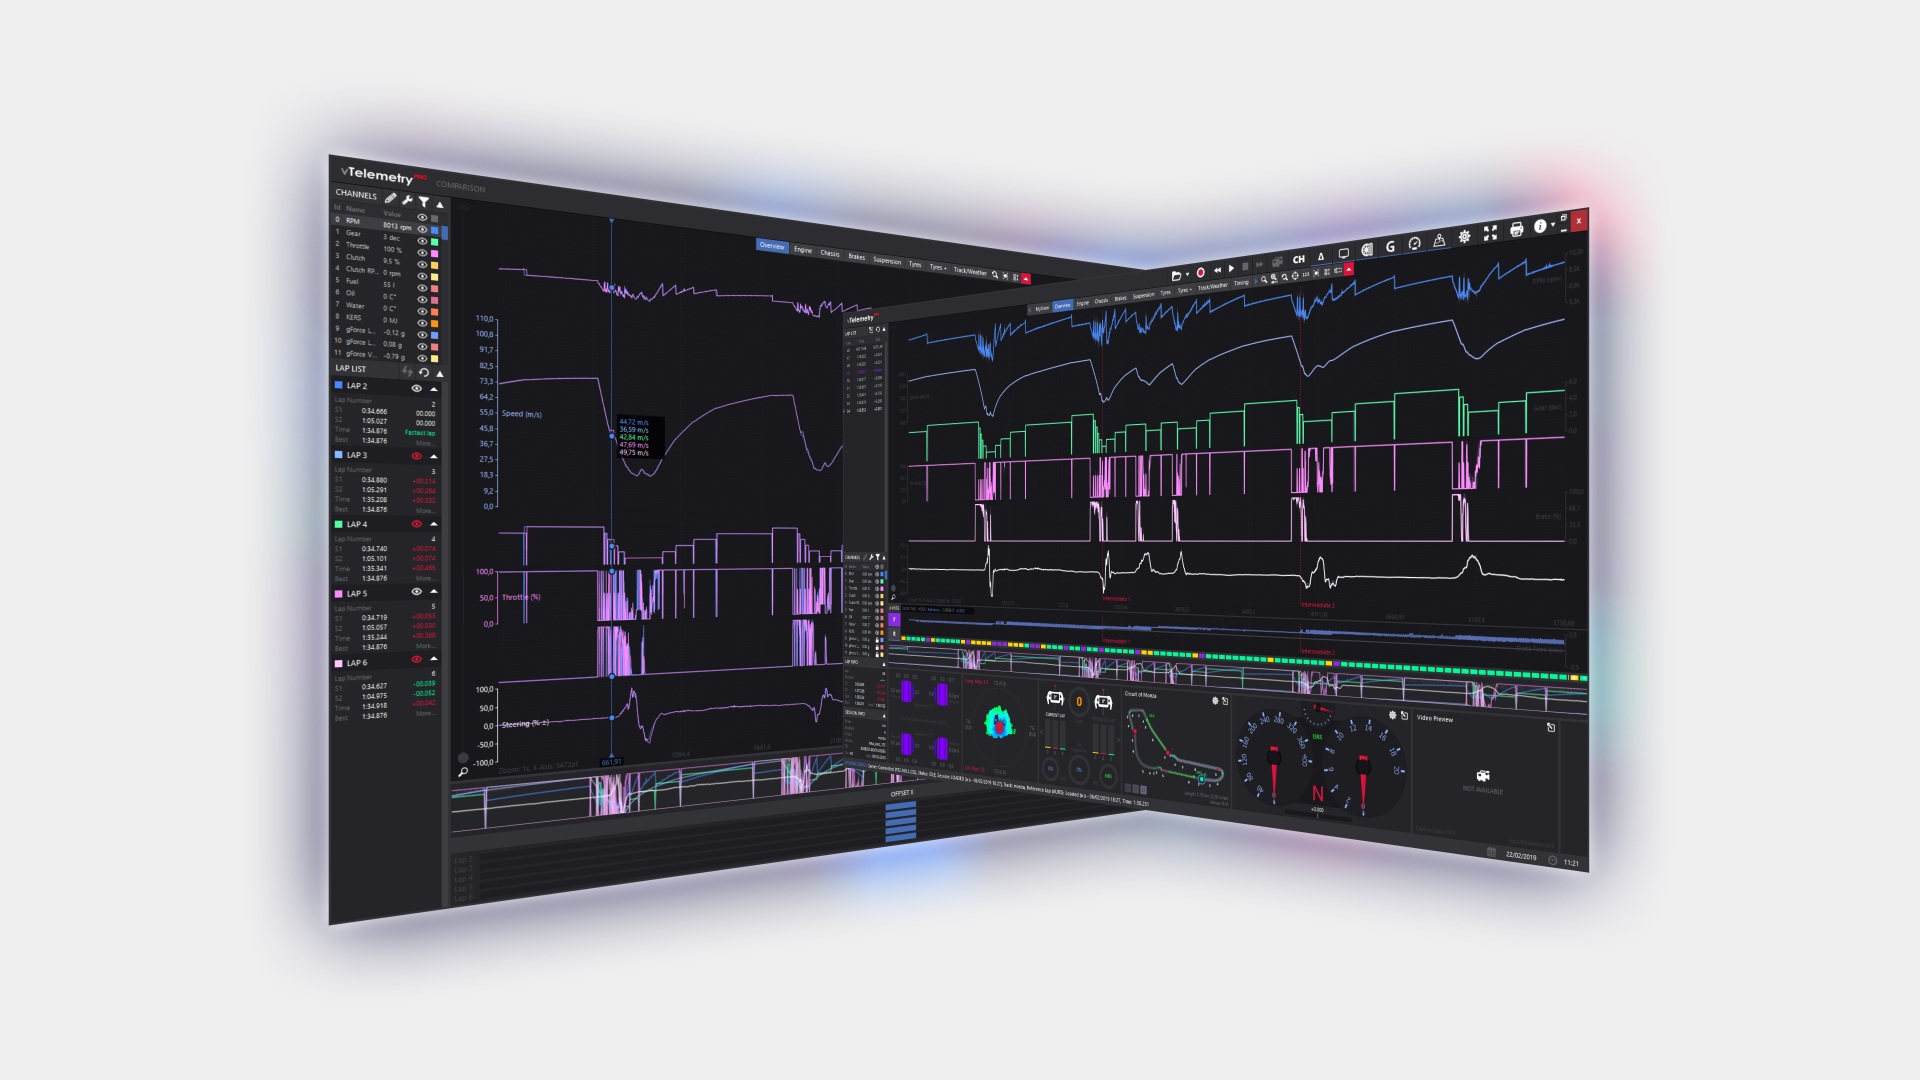
 or another interesting option is to have the name of the signal overlayed in front of the axis ticks, as shown here:
-
Additionally, I would need to display the min/max/avg values in the legend for the given interval
-
As I'm allowing the user to drag and drop signals dynamically onto the plot, I would need to be able to allow selected signals to be deleted, so either a signal label needs to have a delete button before/after or a common delete button should be available which can pick up the selected signal.
Do you have any suggestions how this could be realized? Thank you in advance!
The legend needs to be on the left side for my use case, similar as this example:
putting the legend on the top or right can be done with just CSS: https://github.com/leeoniya/uPlot/issues/704
putting it on the left proved to be a bit trickier due to how flexbox works, though i dont claim to have spent a huge amount of time trying to get it working -- it can probably be done, though.
for a table-style legend you might want to use series.values to return objects with table columns.
or another interesting option is to have the name of the signal overlayed in front of the axis ticks, as shown here:
maybe, but not sure if there's a big advantage over just using an axis label when you have 1 chart per signal. also it would obscure the actual data, so that's not great.
Additionally, I would need to display the min/max/avg values in the legend for the given interval
sounds like another vote for https://github.com/leeoniya/uPlot/issues/644 ?
As I'm allowing the user to drag and drop signals dynamically onto the plot, I would need to be able to allow selected signals to be deleted, so either a signal label needs to have a delete button before/after or a common delete button should be available which can pick up the selected signal.
you could use the addSeries hook to modify the legend's DOM to append a delete button that internally calls u.delSeries(i).
Do you have any suggestions how this could be realized? Thank you in advance!
all that being said, if you need a lot of legend customization, you may find it preferable to simply implement your own legend and just use uPlot's APIs. e.g. in Grafana we have a separate legend component in React that also supports sorting and filtering of legend items as well as other thing needed by the rest of the UI.
Thanks for the detailed answer, that makes sense. I do like the default behavior of the legend with the ability to hide or single out signals, but I would need to overwrite this behavior.
Having the min/max/avg values optionally available would be nice, it is such a common feature it would be great if it comes OOTB, although for my use-case I would like to allow the user to set a start and end gate and calculate these metrics in the gated region (if no gates are set, the zoom windows should be the region of interest).
I think implementing my own legend is probably the way to go, given that I would like the user to be able to change properties of selected signals, so it makes sense to have a side menu pop out with the properties for the (multiple) selected signal(s). (for example shift a group of signals in Y to cover the top 25%, press h to hide signal, s to single out signal, change line style, delete, etc.).
I’m using uplot via react as an exercise to learn react/typescript, so I was dreading this step a bit, but I guess it is just a matter of implementing the right callbacks (to update legend labels on value change, etc.). I have already implemented the ability to drag and drop channels in the graph, so I could implement drag to remove as well, if I have a custom legend.
Just for reference, do you know if there is a recommended way of implementing a custom legend via react? What are the relevant callbacks/hooks I need to tap into?
Thanks!
I have the same need toggles series visibility or focus can be setSeries(idx, {show, focus}) toggles focus does not work
focus works, but you have to set opts.focus.alpha < 1.
https://jsfiddle.net/bqm6rfxk/
const data = [
  [1, 2, 3, 4, 5],
  [0, 1, 2, 3, 4],
  [4, 3, 2, 1, 0],
];

let opts = {
  title: "uplot",
  width: 478,
  height: 280,
  focus: {
    alpha: 0.2,
  },
  series: [
    {},
    {
      stroke: "red",
      fill: "rgba(255,0,0,0.1)"
    },
    {
      stroke: "blue",
      fill: "rgba(0,0,255,0.1)"
    }
  ],
  scales: {
    x: {
      time: false
    }
  }
};

let u = new uPlot(opts, data, document.body);

setTimeout(() => {
  u.setSeries(1, { focus: true });
}, 1000);