Box Plot Demo with single entry breaks graph
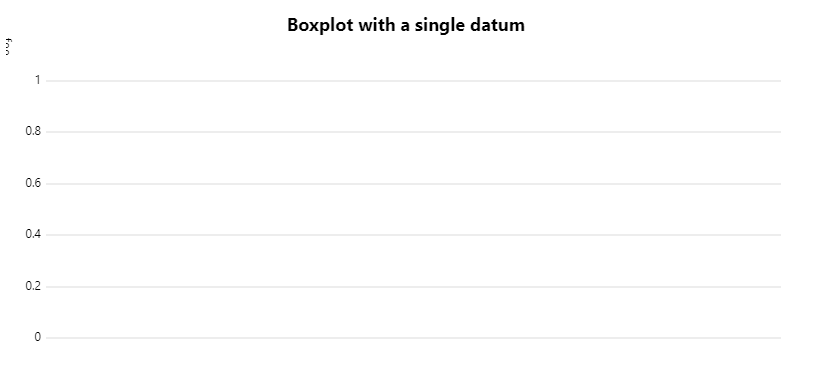
I'm using the Box Plot demo you've provided to display some summary statistics for some data. There's a case where there may only be a single entry to display in the graph, but the result doesn't display the box correctly nor does the x-axis even get displayed. Example: https://jsbin.com/qesexajura/edit?js,output
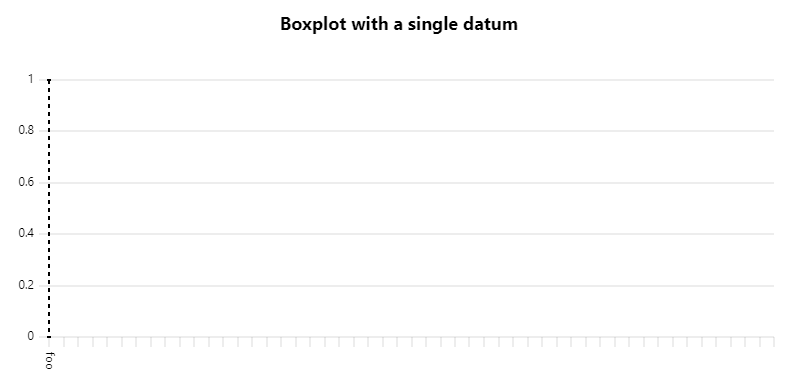
Adjusting scales.x.distr from 2 to 1 correctly displays the box and x-axis, though with a bunch of padding to the right which unnecessarily fills the graph.
Hovering over the graph displays the highlight/legend plugin values for the single entry though. Is there some other adjustments needed here to account for single-element datasets with the box plot plugin?
probably a bug in the demo/plugin code. not sure when i'll have a chance to fix it (maybe next week), but the code is pretty straightforward if you want to try submitting a fix.
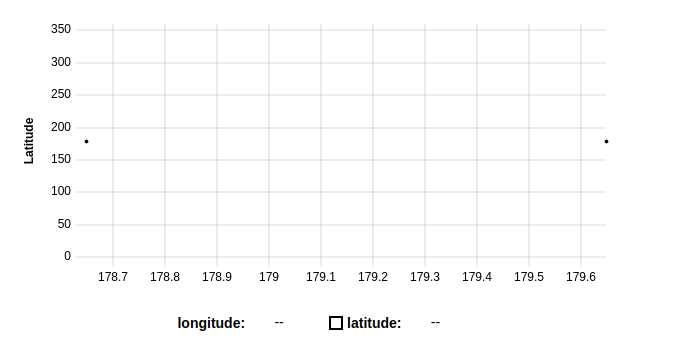
Just noticed similar where all points are the same on a non-time plot
    const config = {
      "width": 625,
      "height": 300,
      "timeFormats":
      {
        "md": "{D}/{M}"
      },
      "cursor": {
        "points": {
          "size": 6
        },
        "x": true,
        "y": true,
        "sync": false
      },
      "scales": {
        "x": {
          "time": false
        },
        "1": {
          "title": "Latitude (°)"
        }
      },
      "series": [
        {
          "label": "longitude"
        },
        {
          "scale": "1",
          "paths": () => null,
          "stroke": "black",
          "spanGaps": true,
          "show": true,
          "points": {
            "show": true,
            "size": 4,
            "fill": "black"
          },
          "label": "latitude"
        }
      ],
      "axes": [
        {},
        {
          "scale": "1",
          "label": "Latitude"
        }
      ]
    };

    const data = [
        [179.6484375, 179.6484375, 179.6484375, 179.6484375, 179.6484375, 179.6484375, 179.6484375, 179.6484375, 179.6484375, 179.6484375, 179.6484375, 179.6484375, 179.6484375, 179.6484375, 179.6484375, 179.6484375, 179.6484375, 179.6484375, 179.6484375, 179.6484375, 179.6484375, 179.6484375, 179.6484375, 179.6484375, 179.6484375, 179.6484375, 179.6484375, 179.6484375, 179.6484375, 179.6484375, 179.6484375, 179.6484375, 179.6484375, 179.6484375, 179.6484375, 179.6484375, 179.6484375, 179.6484375, 179.6484375, 179.6484375, 179.6484375, 179.6484375, 179.6484375, 179.6484375, 179.6484375, 179.6484375, 179.6484375, 179.6484375, 179.6484375, 179.6484375, 179.6484375, 179.6484375, 179.6484375, 179.6484375, 179.6484375, 179.6484375, 179.6484375, 179.6484375, 179.6484375, 179.6484375, 179.6484375, 179.6484375, 179.6484375, 179.6484375, 179.6484375, 179.6484375, 179.6484375, 179.6484375, 179.6484375, 179.6484375, 179.6484375, 179.6484375, 179.6484375, 179.6484375, 179.6484375, 179.6484375, 179.6484375, 179.6484375, 179.6484375, 179.6484375, 179.6484375, 179.6484375, 179.6484375, 179.6484375, 179.6484375, 179.6484375, 179.6484375, 179.6484375, 179.6484375, 179.6484375, 179.6484375, 179.6484375, 179.6484375, 179.6484375, 179.6484375, 179.6484375, 179.6484375, 179.6484375, 179.6484375, 179.6484375, 179.6484375, 179.6484375, 179.6484375, 179.6484375, 179.6484375, 179.6484375, 179.6484375, 179.6484375, 179.6484375, 179.6484375],
        [179.6484375, 179.6484375, 179.6484375, 179.6484375, 179.6484375, 179.6484375, 179.6484375, 179.6484375, 179.6484375, 179.6484375, 179.6484375, 179.6484375, 179.6484375, 179.6484375, 179.6484375, 179.6484375, 179.6484375, 179.6484375, 179.6484375, 179.6484375, 179.6484375, 179.6484375, 179.6484375, 179.6484375, 179.6484375, 179.6484375, 179.6484375, 179.6484375, 179.6484375, 179.6484375, 179.6484375, 179.6484375, 179.6484375, 179.6484375, 179.6484375, 179.6484375, 179.6484375, 179.6484375, 179.6484375, 179.6484375, 179.6484375, 179.6484375, 179.6484375, 179.6484375, 179.6484375, 179.6484375, 179.6484375, 179.6484375, 179.6484375, 179.6484375, 179.6484375, 179.6484375, 179.6484375, 179.6484375, 179.6484375, 179.6484375, 179.6484375, 179.6484375, 179.6484375, 179.6484375, 179.6484375, 179.6484375, 179.6484375, 179.6484375, 179.6484375, 179.6484375, 179.6484375, 179.6484375, 179.6484375, 179.6484375, 179.6484375, 179.6484375, 179.6484375, 179.6484375, 179.6484375, 179.6484375, 179.6484375, 179.6484375, 179.6484375, 179.6484375, 179.6484375, 179.6484375, 179.6484375, 179.6484375, 179.6484375, 179.6484375, 179.6484375, 179.6484375, 179.6484375, 179.6484375, 179.6484375, 179.6484375, 179.6484375, 179.6484375, 179.6484375, 179.6484375, 179.6484375, 179.6484375, 179.6484375, 179.6484375, 179.6484375, 179.6484375, 179.6484375, 179.6484375, 179.6484375, 179.6484375, 179.6484375, 179.6484375, 179.6484375, 179.6484375]
];

    new uPlot(config, data, document.body);
Result is

Changing one value results in
Guess it's to do with the auto scaling and a zero value range. Will take a look if I get a chance.
From the Readme:
x-values must be numbers, unique, and in ascending order.
y-values must be numbers (or nulls for missing data).
x-values and y-values arrays must be of equal lengths >= 2.
so I guess both your cases are not handle, is that correct @leeoniya ?
From the box demo
let columnWidth = u.bbox.width / (u.scales.x.max - u.scales.x.min); => divide by 0 for 1 point graph
the data format in the readme is mostly for the built-in pathbuilders. but plugins that implement custom rendering can do whatever they want. these days single points are supported by uPlot: https://leeoniya.github.io/uPlot/demos/no-data.html
the box plot demo / plugin would probably be fixed by making columnWidth fall back to u.bbox.width or some static max width value if the divisor is 0.