uPlot
 uPlot copied to clipboard
📈 A small, fast chart for time series, lines, areas, ohlc & bars

Hi, I often use tooltip and always modifier plug-in is not practice. Since time ago, I inserted code in core to have tooltip like a property. I have updated with...
I would like to have a scatter plot with buttons to add/delete series to the plot as in the jsfiddle below. However, attempting to add a series using the corresponding...
I want to get something like this 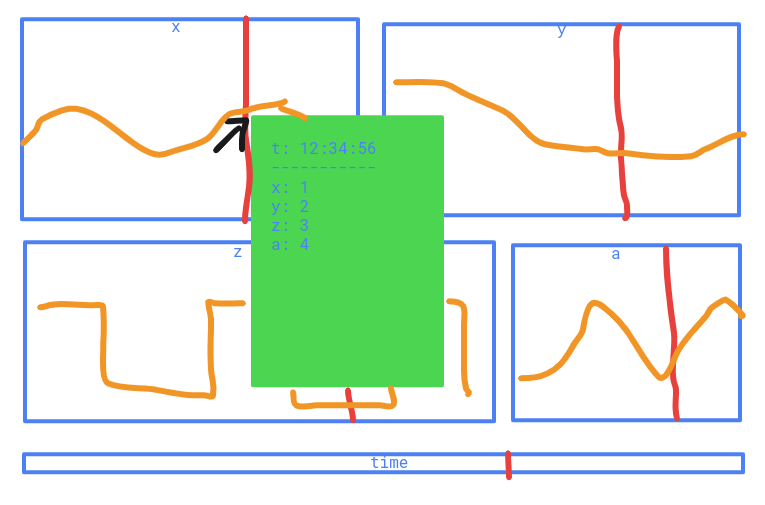 Where I have shared cursor. And want show in tooltip info from all uplot graphs. And if is it possible at the...
I am drawing on the canvas on series click and the cursor is locked until I click again in the canvas. I'm trying to trigger that same behavior but from...
Hi, I have a problem with the wheel zoom plugin. When I add new points, the zoom stay with only the first point. How can I "refresh" the zoom ?...
I have uPlots embedded in pages where I'm using a CSS transform to scale the entire page up or down. This mostly works, but the mouse position is not tracked...
Hey, have you experimented at all with offscreen canvas? I'm trying to draw ~10+ plots * many series and running into some performance issues with Flot. My data is already...
Is it possible to define `borderStyle` in the legend per every series separately? Also, it might be worth to consider using `dotted` border style for every series which has `dashed`...
Great work on this library! It's awesome the focus is on most critical features and keeping it small. Though just wondered, is tree shaking supported during bundling to make it...
I would like to use uPlot with mode 2 data and TypeScript. uPlot only accepts data of type AlignedData at the moment. @leeoniya Is this something that you plan to...