php-monitor
 php-monitor copied to clipboard
A free, flexible, powerful tool that helps you monitor PHP Service and profiling PHP code.
php-monitor
A free, flexible, powerful tool that helps you monitor PHP Service and profiling PHP code.


English | ç®ä½ä¸æ
⨠Features
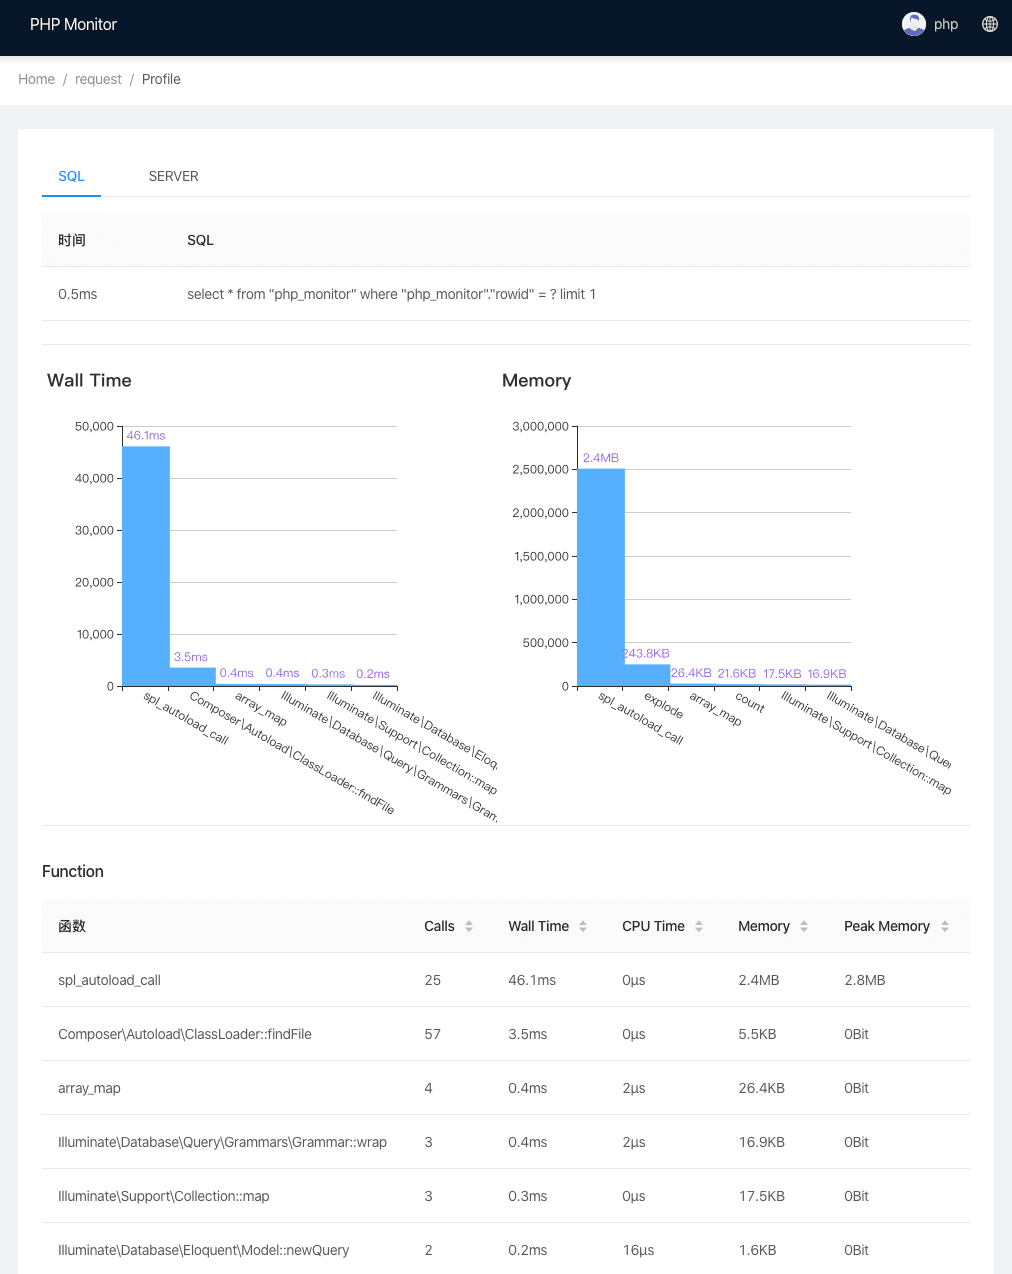
- ð Get detailed PHP runtime data.
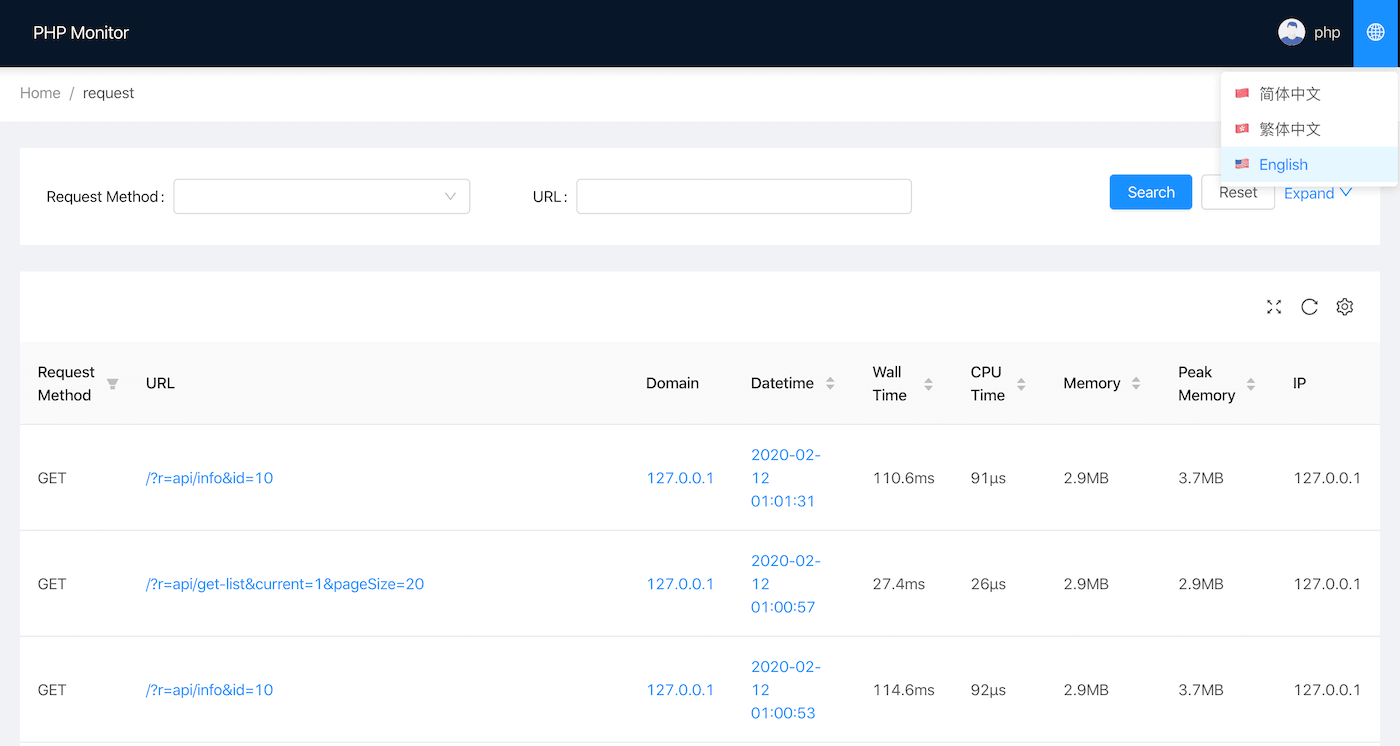
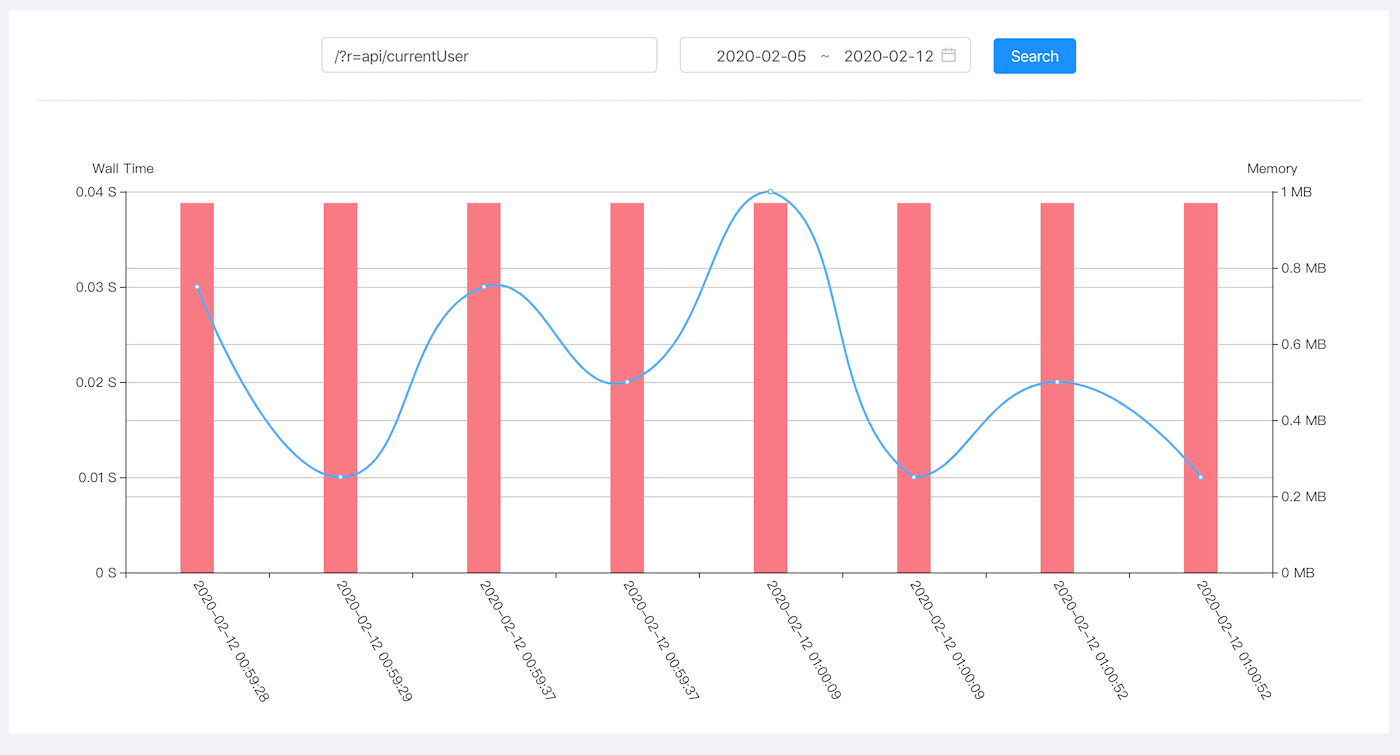
- ð Monitor production environment time consuming requests.
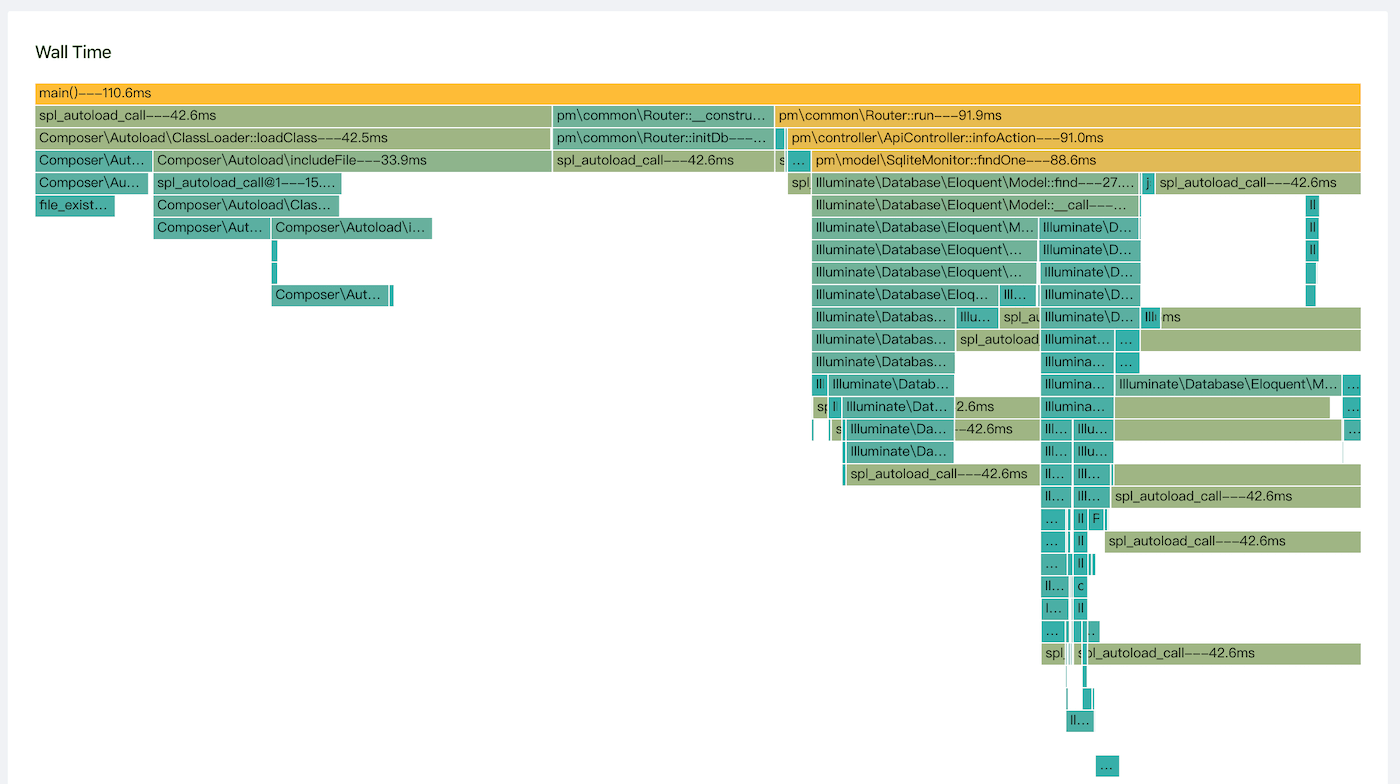
- ð¡ Displays the memory and CPU consumption of the underlying function.
- ð¨ Use various kinds of visual graphics to display data.
âï¸ System requirements
- uprofiler,xhprof,tideways php extension(default tideways).
- composer
- PHP 5.6+
Install tideways extension
PHP 5.6(download tideways v4.1.5) PHP 7.0+(download tideways v4.1.7)
wget --no-check-certificate https://github.com/tideways/php-xhprof-extension/archive/v4.1.7.tar.gz && tar zxvf v4.1.7.tar.gz && cd php-xhprof-extension-4.1.7 && phpize && ./configure && make && sudo make install
Add configuration data on php.ini.You should see something like:
extension=tideways.so
Once installed, you can use the following command to check:
> php --ri tideways
tideways
tideways => 4.1.7
Install php-monitor
composer create-project --prefer-dist --ignore-platform-reqs laynefyc/php-monitor php-monitor && cd php-monitor/public && php -S 127.0.0.1:8066
Visit http://127.0.0.1:8066 and input account and password(php/php).
Detailed installation tutorial
-
Download & Update Projects
composer create-project --prefer-dist --ignore-platform-reqs laynefyc/php-monitor php-monitoror
git clone https://github.com/laynefyc/php-monitor.git cd php-monitor composer update --ignore-platform-reqs -
The project can set data storage mode and supports MySQL, MongoDB, SQLite. Set in configuration file
src/config/config.php,The information is as follows:// 'save' => [ // 'driver' => 'mysql', // 'host' => '127.0.0.1:3306', // 'database' => 'php_monitor', // 'username' => '', // 'password' => 'abcd1234', // 'charset' => 'utf8mb4' // ], // 'save' => [ // 'driver' => 'mongodb', // 'host' => '127.0.0.1:27017', // 'database' => 'php_monitor', // 'username' => '', // 'password' => '' // ], 'save' => [ 'driver' => 'sqlite', 'database' => dirname(__DIR__).'/db/php_monitor.sqlite3' ],SQLite is used by default in this projectï¼if you use other databases, please uncomment them.
If you want to use MySQL to run the following table creation statement (table name cannot be modified):
CREATE TABLE `php_monitor` ( `id` bigint(20) unsigned NOT NULL AUTO_INCREMENT COMMENT 'Auto-increment number ', `url` text CHARACTER SET utf8 COMMENT 'Request URL', `server_name` varchar(255) CHARACTER SET utf8 DEFAULT NULL COMMENT 'Service name', `get` text COMMENT 'GET parameter', `pmu` int(11) unsigned DEFAULT NULL COMMENT 'Memory spike', `wt` int(11) unsigned DEFAULT NULL COMMENT 'Total time spent in microseconds', `cpu` int(11) unsigned DEFAULT NULL COMMENT 'Total CPU cycle time', `ct` int(3) NOT NULL COMMENT 'Total calls', `mu` int(11) unsigned DEFAULT NULL COMMENT 'Current memory consumption', `request_time` int(10) unsigned NOT NULL DEFAULT '0' COMMENT 'Request time accurate to seconds', `request_time_micro` int(10) unsigned DEFAULT '0' COMMENT 'Request time accurate to microseconds', `profile` longblob NOT NULL COMMENT 'performance data, `server` longblob COMMENT 'SERVER parameter', `type` varchar(16) DEFAULT NULL COMMENT 'Request time includes GETï¼POST', `ip` varchar(16) DEFAULT NULL COMMENT 'IP address', PRIMARY KEY (`id`), KEY `idx_url` (`url`), KEY `idx_ip` (`ip`) ) ENGINE=MyISAM AUTO_INCREMENT=1 DEFAULT CHARSET=utf8mb4;Mongodb database will build its own tables, but it needs to add indexes by yourself.The adding way as followsï¼
show dbs
use php_monitor //Please select your own database
db.php_monitor.createIndex({"url":1})
db.php_monitor.createIndex({"ip":1})
The table name for all data storage methods must be
php_monitorand does not support modification. -
The operation of monitoring platform
It can directly pass the following command during testingï¼
cd php-monitor/public
php -S 127.0.0.1:8066
After running successfully ,It can be accessed http://127.0.0.1:8066directly .
Non-test environment please use Nginx.The configuration is as followsï¼
server { listen 8066; server_name localhost; root /home/www/cai/php-monitor/public; index index.php index.html; location / { root /home/www/cai/php-monitor/public; } location ~ \.php$ { fastcgi_pass 127.0.0.1:9000; include fastcgi_params; fastcgi_param SCRIPT_FILENAME $document_root/index.php; } } -
Login background
Login account password can be modified directly in the configuration fileï¼
src/config/config.phpã'user' => [ //login account and password ['account'=>'php','password'=>'php'], ['account'=>'admin','password'=>'abcd'] ]Please change the account number and password in time after release. If you require a higher level of security, please extend the method of Login Controller.php file.
-
Introduce monitoring into the project.
The project is monitored in a non-invasive way, without any interference to the service in operation.
There are two ways to add monitoring to a project. One is to modify the nginx configurationï¼
For example, to monitor the running service www.site.com, you only need to add a line of configuration information in the nginx configuration file
fastcgi_param PHP_VALUE "auto_prepend_file={php-monitor-path}/src/autoPrepend.php";The effect of adding configuration is as follows (other content is just for demonstration, not the same nginx configuration)ï¼
server {
  listen 80;
  server_name www.site.com;
  root your/webroot/;
  location ~ \.php$ {
      fastcgi_pass   127.0.0.1:9000;
      include        fastcgi_params;
      fastcgi_param  SCRIPT_FILENAME  $document_root/index.php;
      fastcgi_param PHP_VALUE "auto_prepend_file={php-monitor-path}/src/autoPrepend.php";
  }
}
This way is to use the
auto_prepend_fileinterface provided by PHPï¼interfaceing https://www.php.net/manual/zh/ini.core.php#ini.auto-prepend-file.You need to restart nginx after adding configuration.The second way is to import the entry file that needs to monitor the project directly , usually add it in
public/index.phpï¼require '/home/www/cai/php-monitor/src/autoPrepend.php';The effect after adding configuration is as follows (except the core code, the other code is for demonstration):
<?php
use pm\common\Router;

//The core code is here
require '/home/www/cai/php-monitor/src/autoPrepend.php';

include 'vendor/autoload.php';
$config = require('src/config/config.php');
(new Router($config))->run();
After adding the burying point, the request record of www.site.com project can be viewed in the http://127.0.0.1:8066 monitoring background.
-
More details
- MongoDB has the fastest storage speed. If you have high performance requirements, please use it first.
- Modify the profile.enable property of the configuration file to modify the sampling frequency. Generally speaking, it is not necessary to store all requests.For example, 'rand (1, 100) > 60' is to set the sampling rate to '40%';
- Modify the profiler.filter_path attribute of the configuration file to filter services that you do not want to collect, such as some intranet services that do not care about execution efficiencyï¼
-
Swoole support
public function onReceive(\swoole_server $serv, $fd, $from_id, $dataSrc)
{
    require '/home/www/cai/php-monitor/src/autoPrepend.php';

    //your code

    \pm\common\PMonitor::shutdown($data['params']['route'],$serv->getClientInfo($fd,$from_id)['remote_ip'],'TCP');
}
TODO
- [x] Sqlite storage mode developmentï¼
- [x] Perfect internationalizationï¼
- [x] Improve documentationï¼
- [x] CI process accessï¼
- [x] Supplementary unit testï¼
- [x] Composer package encapsulationï¼
- [ ] Rewrite xhprof extensionï¼
- [ ] Separation of buried point module and display moduleï¼
- [ ] Docker accessï¼
Feedback
Please submit your issues.