Regression in v0.6.0 when using an `INSERT ... RETURNING` clause with SQLite
Compiling a non-trivial INSERT query that contains a RETURNING clause results in long compile times, with very high memory consumption.
I've created an example repository which demonstrates the issue: jaehl/sqlx-bug
With v0.6.0 that project compiles on my machine in 100 seconds (and using 7GB of memory). With v0.5.13 it compiles in about 150 milliseconds.
First bad commit appears to be ed56622526298cd1df52338892dd5c6c9553b6d2 (more specifically it seems to be this commit from the PR: e5a5e36f6664878e0280ba6cd204be4bb7c1148a).
cc @tyrelr who worked on the refactors to SQLite, sounds like some unintentional exponential blowup.
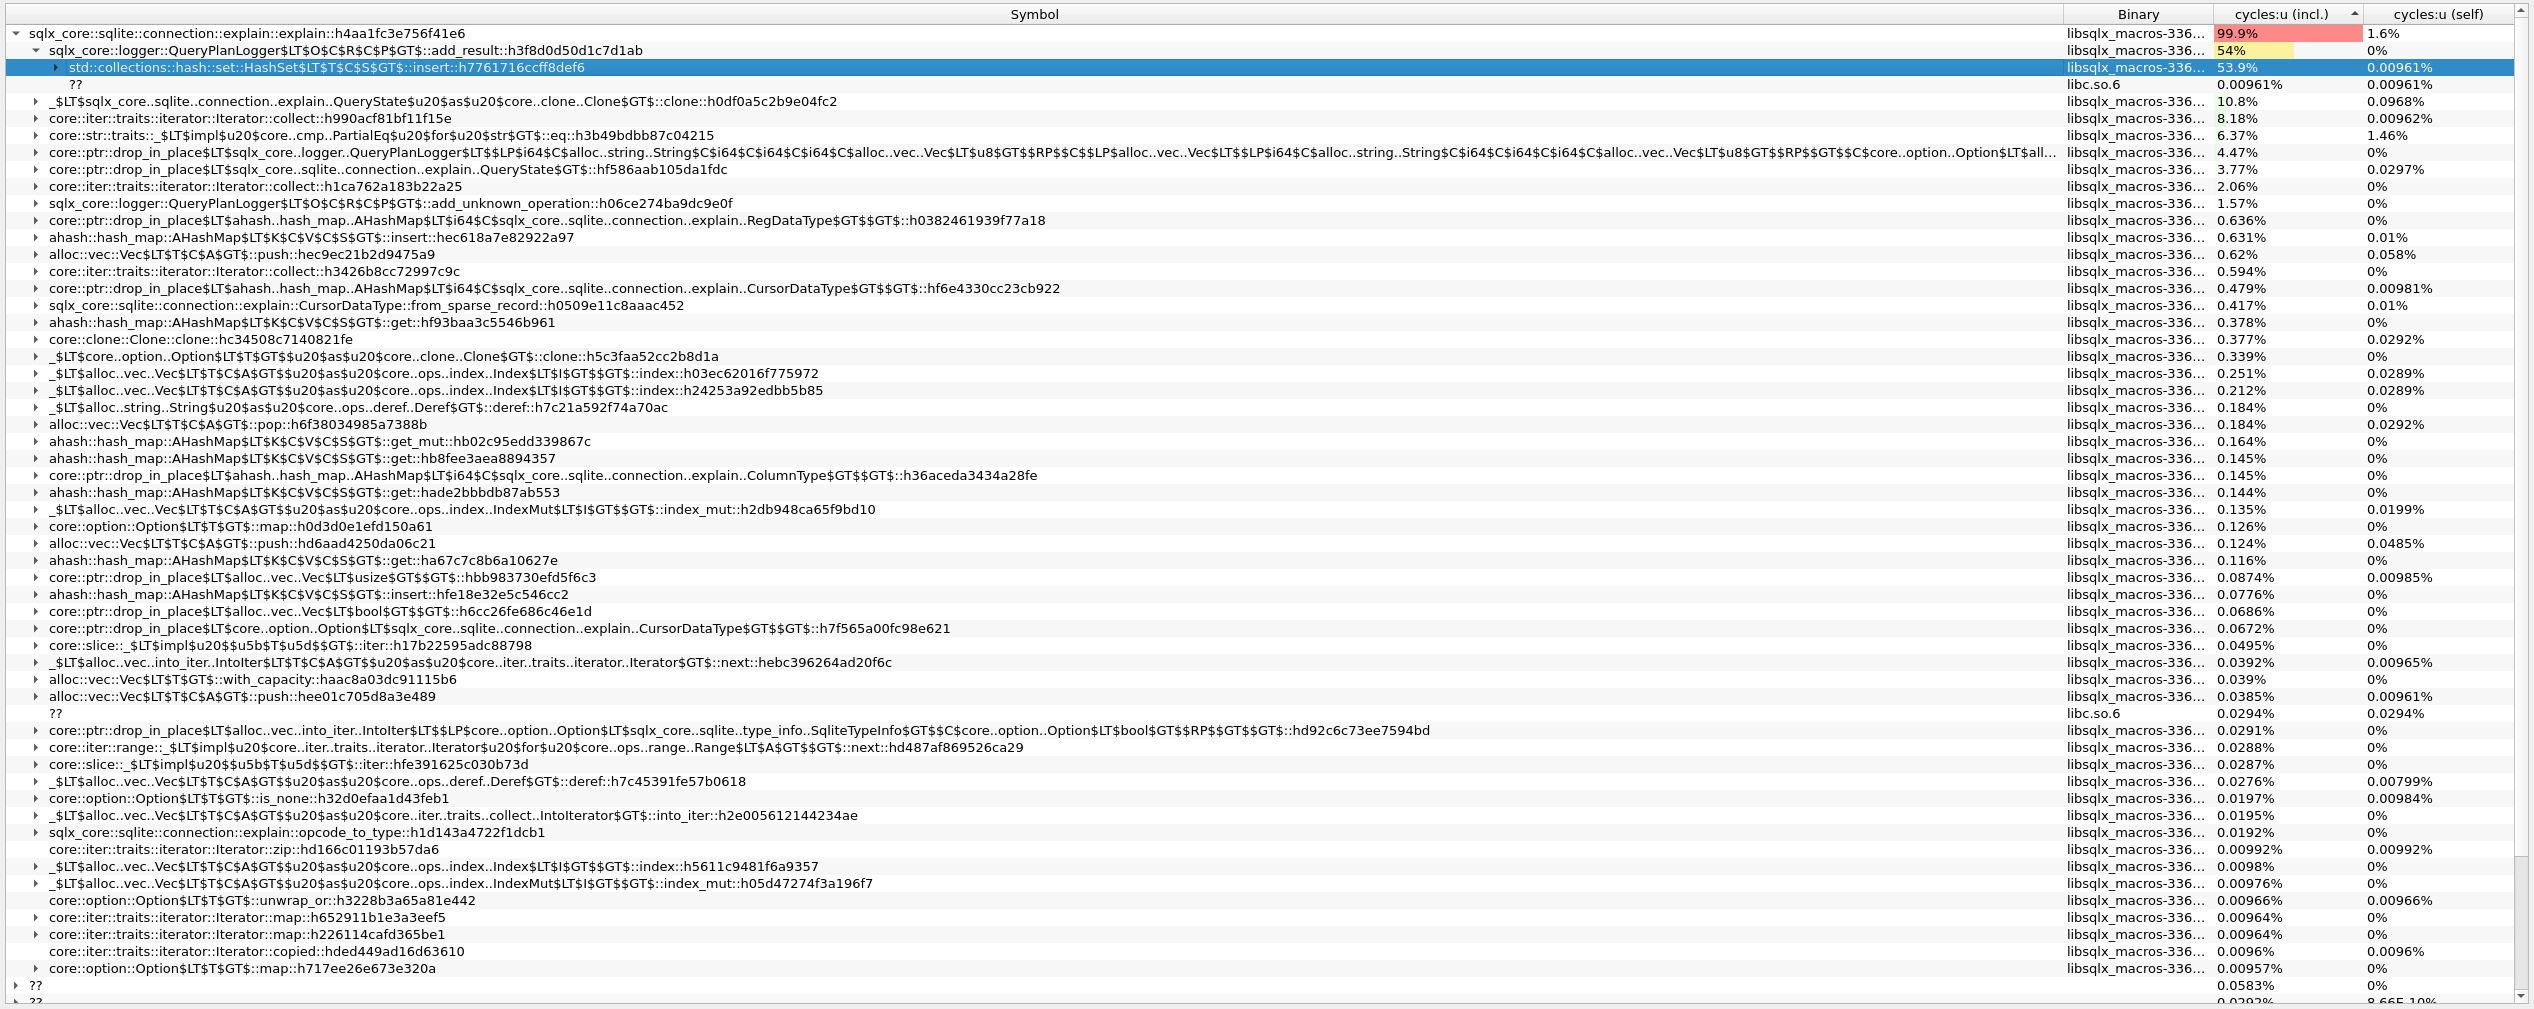
I went ahead and gathered a perf profile and it looks like an overwhelming amount of time is spent in QueryPlanLogger::add_result(), specifically HashSet::insert():
And here's the output of EXPLAIN for that query in a Gist: https://gist.github.com/abonander/1e189216efb5941cf25824b6db2a9090
Thanks for the perf results.
The call to logger.add_result is hashing a Vec<(i64, String, i64, i64, i64, Vec
I see a few ways to improve performance of that:
- use Vec instead of hashset (it should have no duplication anyways)
- move the '.map()' conversion history indices into operations until output-time, to avoid clone-ing each operation for each distinct historical path to a ResultRow
- check log-level before even making calls to the logger
I was hoping to use the logging to see how many end-to-end paths to ResultRow commands are found. But, I haven't convinced cargo/sqlx-cli to show me the logs from running explain. Hopefully I'll have some time to look closer on the weekend.
After playing with the code for a bit, this looks like a combination of a HUGE number of potential unique paths, exacerbating the inefficient logging code.
On my machine I can see these numbers when I run the reproducer:
0.5.7 --------------------------------------- real    0m0.333s
0.6.0 --------------------------------------- real    3m16.316s
(and against some local builds)
0.6.0 without the logging code -------------- real    1m5.493s
0.6.0 with 'merged' path detection & bail --- real    0m27.714s
I've run out of time for now, so haven't figured out how many execution paths were kept vs. pruned by merged path detection, nor measured the timing of combining the 2 approaches.
There was a fix PR opened in #1946 but I'm still waiting for response from the author.