`tabodds` displays most recent graph
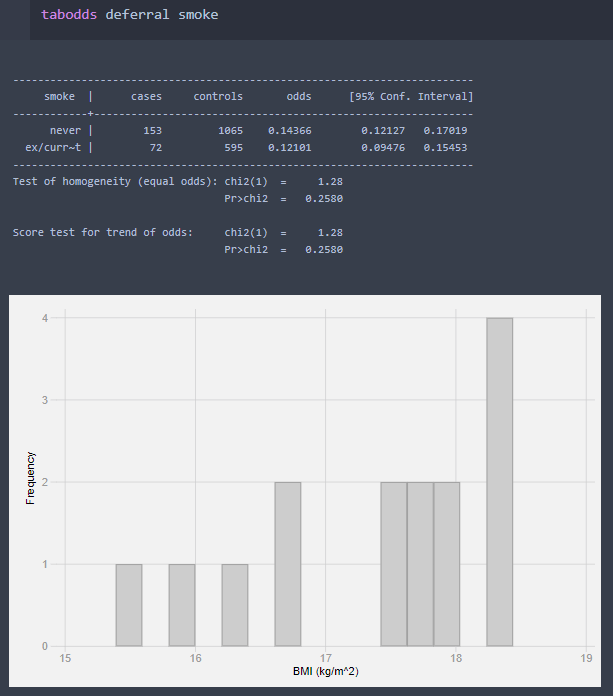
When I use the tabodds command it displays the most recent graph in the same cell printout. Whilst this isn't the biggest issue in a notebook, it can make it particularly long, so would be nice to find a fix to this. Unfortunately, updating the stata_kernel to the most recent version has not solved the issue. I have attached an image of the command, and the debugging log.
Window 10 StataIC 15 stata_kernel 1.11.2.
So you're using tabodds expecting the text results but not the image displayed?
You see the graph because tabodds is designated as a command that produces a graph, so whenever you call tabodds the most recent graph is displayed.
https://github.com/kylebarron/stata_kernel/blob/73071a0b4f480493910b9aebc4c3ce8de88aa613/stata_kernel/code_manager.py#L12-L31