Apiserver/etcd produce very many logs message at kubernetes version 1.20
What happened?
We have updated our seed cluster from kubernetes 1.19.3 to 1.20.14 with kubeone, because the certificates are about to expire.
Currently we have the problem that the connection to the kkp user cluster responds very slowly and sometimes gets a connection refused.
We see at apiserver from all customer user a lot of logs:
I0223 08:25:54.073168 1 passthrough.go:48] ccResolverWrapper: sending update to cc: {[{https://etcd-0.etcd.cluster-j7hj7dd9n7.svc.cluster.local.:2379
We think that the apiserver /etcd are overloaded from this and they responds very slowly..
What should happen?
Do not produce so many logs. We see this issues:
https://github.com/kubernetes/kubernetes/issues/98720
How to reproduce?
Upgrade to 1.20 kubernetes version
Environment
- KKP Version: 2.17.2
- Shared or separate master/seed clusters?: shared
- Master/seed cluster provider: -
Hey @dbagarozza! Since you found the corresponding upstream issue, this is something that was fixed on Kubernetes' side and is related to that upstream component logging too much. There isn't really anything we can do on the KKP side about it. It seems that this will go away as soon as you upgrade to Kubernetes 1.22 (supported with KKP 2.18+).
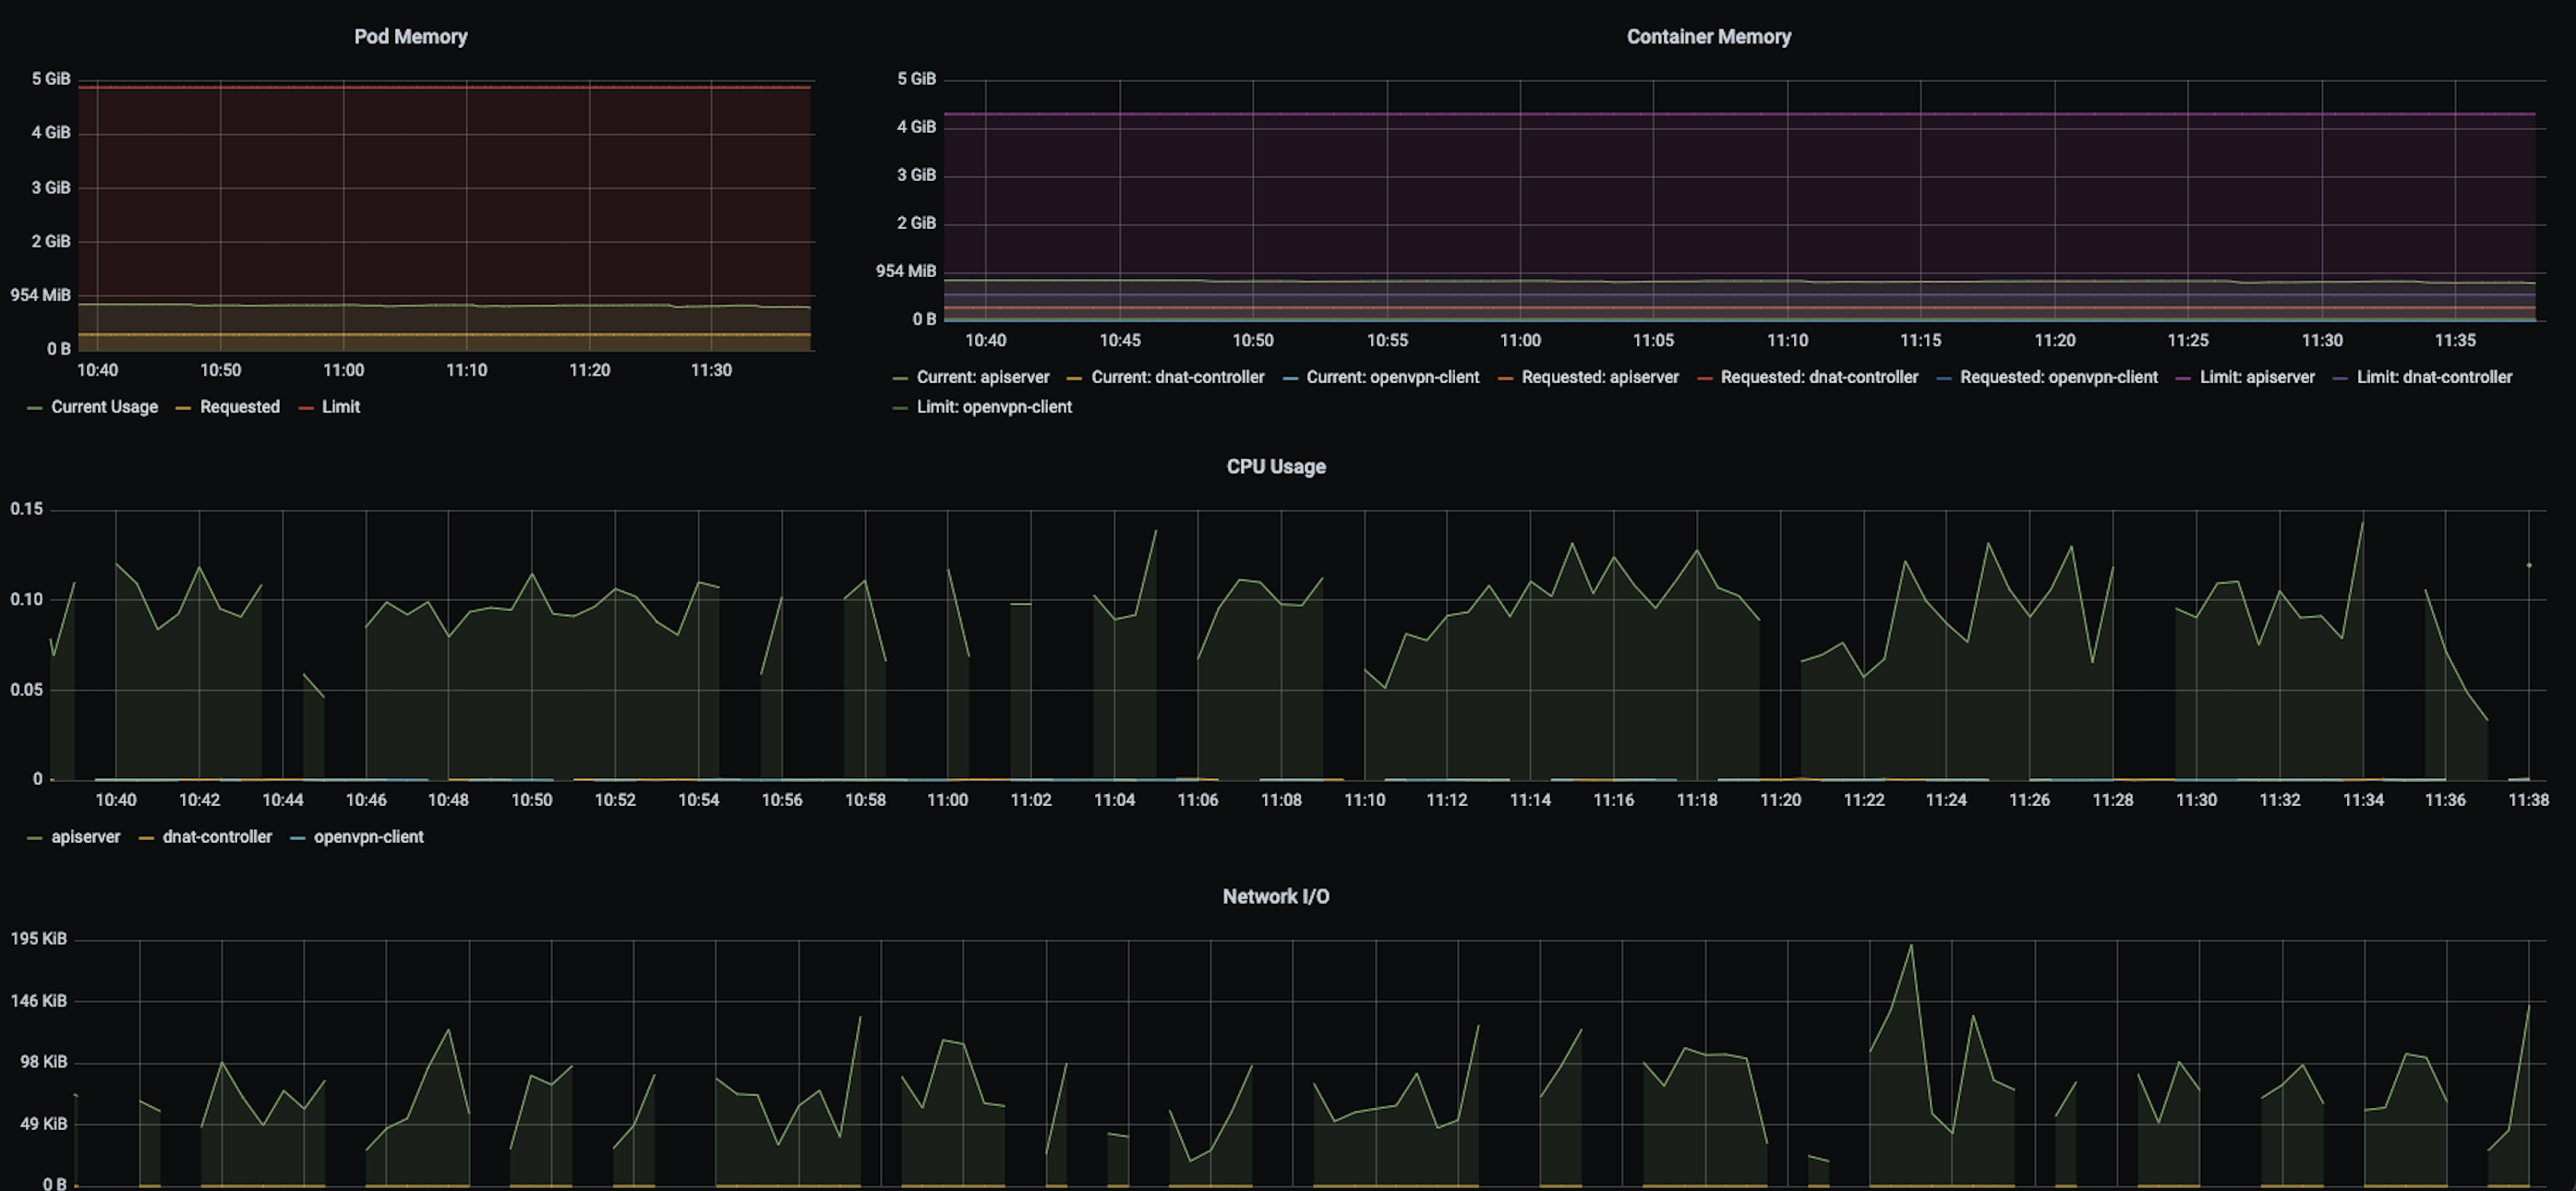
It should not be related to overloaded etcds though. If you have our monitoring stack set up, I would suggest to check out monitoring for etcd, specifically the etcd dashboard, with particular focus on the "Disk Sync Duration" panel (or the underlying metrics, job:etcd_disk_wal_fsync_duration_seconds_bucket:99percentile and job:etcd_disk_backend_commit_duration_seconds_bucket:99percentile). That might help identifying possible problems for your etcds (if you can share it here, for example). In addition, checking out Pod resource usage in general might help identifying if your control plane components need component overrides because they hit CPU or memory limits.
@embik thanks for the information.
We have a setup with 3 Master nodes and 6 worker nodes for 16 clusters. Master nodes has 16gb ram and 4 cores and worker node 8 cores with 16gb ram.
one disk sync duration from a user cluster:
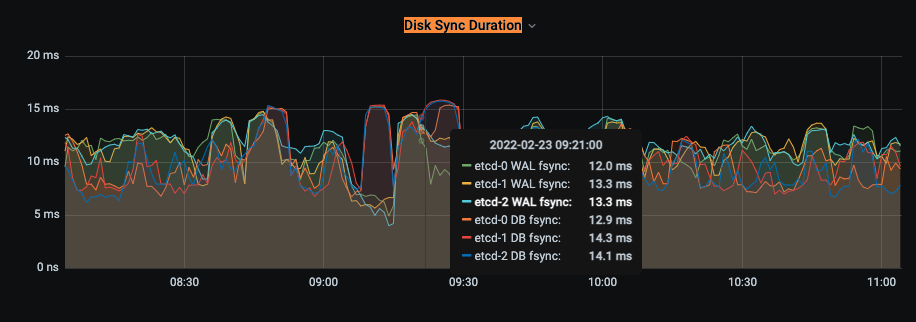
with all cluster the value looks like this.
also the worker nodes of our seed cluster looks normal.
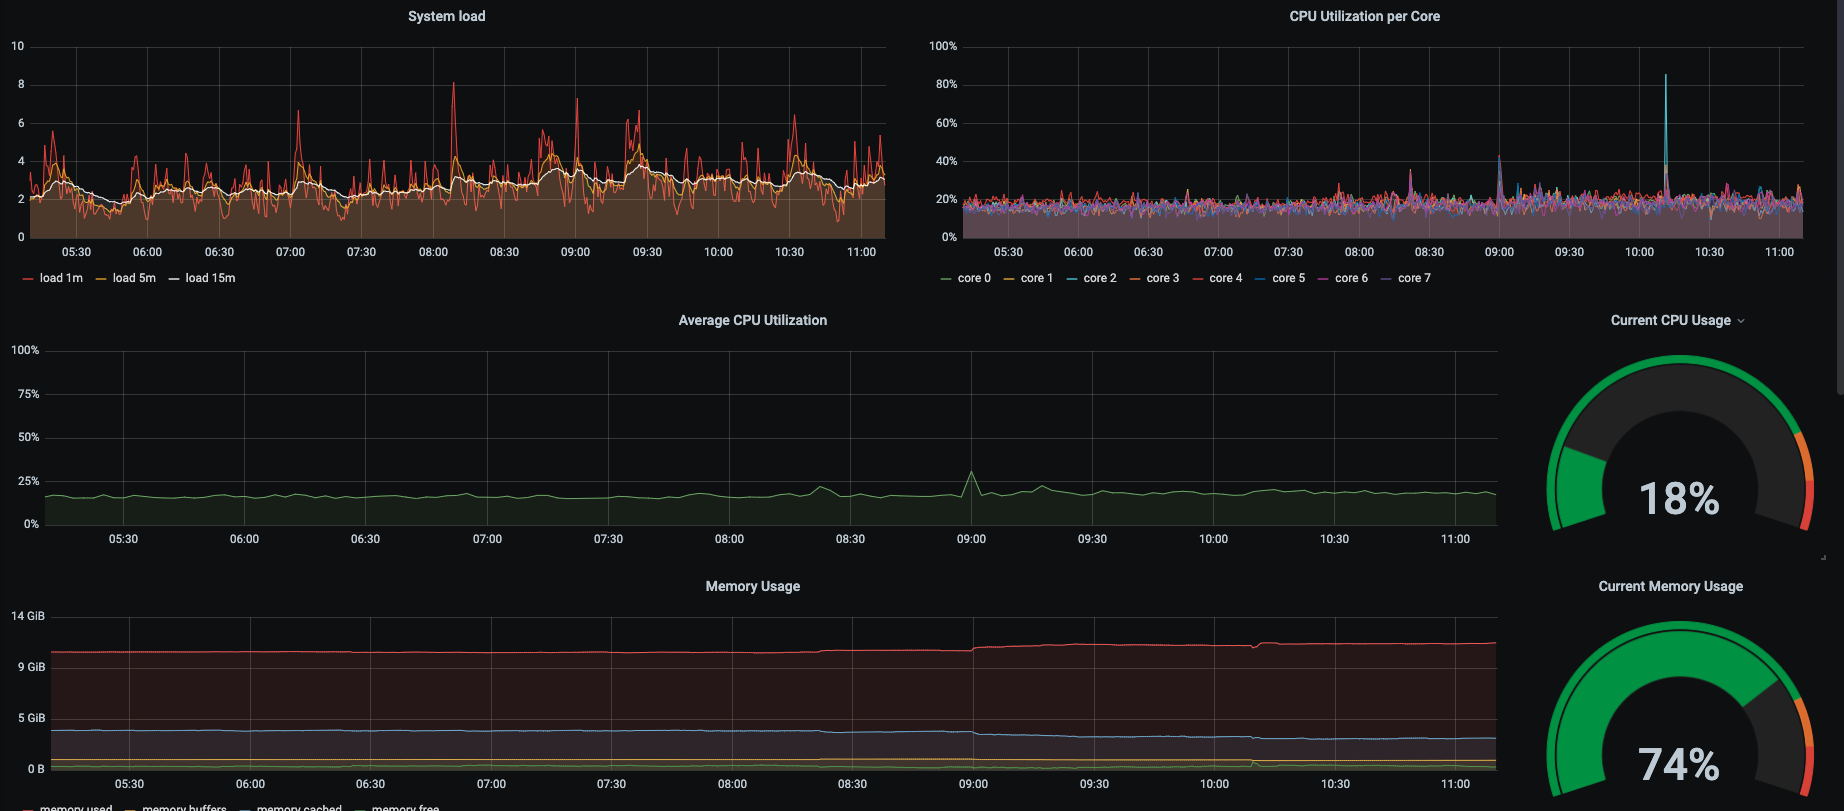
looks like this on all worker nodes.
as from time to time we also have dropouts in the metrics from user cluster:
we also have a another problem that prometheus alerts that apiserver will expire in some days. We opened an another issue:
https://github.com/kubermatic/kubermatic/issues/9046
but kubeadm and the api prints the new one.
That seems to be unrelated.
The metrics so far look reasonably good. For the missing metrics, I'm actually not sure it's really an issue, it might be just the resolution. Metrics are only scraped every few seconds, so this might be a display issue.
What load balancing solution are you using? The initial ticket unfortunately does not list the provider that your master/seed setup is running on.
metallb with nginx ingress controller, communication over nodeport service. We use as provider vsphere with ubuntu template 18.04.6
Since your control plane metrics look good and don't suggest anything is overloaded or slow to respond, I'd recommend investigating if the MetalLB setup is maybe the problem, for example by launching a "dummy" service and checking if you see similar behaviour from that when exposed via MetalLB. I'd advise against using an Ingress for that because the ingress-controller is not used for Kubernetes API endpoints either.
@embik
we have tried some things..direct kubectl forward the apiserver from kkp user cluster, the request works. Forward via the nodeport-service only partially, when we reboot the nodeport-proxy-envoy pods it runs for a short time really good.
I have closed the Prometheus Alert issue. We had to replace the kubeconfig in our seed config with the new one.
Can you please share more information about your setup, like the KubermaticConfiguration and Seed resources where possible (make sure to redact any information you'd like to keep private, but for example the expose strategy would be interesting here). Please also check the monitoring data for the nodeport-proxy-envoy Pods specifically. Maybe that one is hitting some limits.
KKP v2.17.5 also introduced a fix for nodeport-proxy-envoy resource settings (#8169), perhaps that helps with scheduling and resource allocation as well.
we updated kubermatic to 2.17.5 but the problem still exist. We want to allocate more ram at the nodeport proxy envoy, but this does not work.
We updated our seedconfig, it also says so in your documention. But the nodeport proxy envoy pods are not rolled and are still at the default value 128mb.
In the seedconfig the value is correct.
Hey @dbagarozza, apologies for the late reply. If you are still trying to do this, can you please share your Seed resource in which you are attempting to configure the envoy resources? Please also note that KKP 2.17 is out of general support, so I would recommend updating to a more recent minor release.
Issues go stale after 90d of inactivity.
After a furter 30 days, they will turn rotten.
Mark the issue as fresh with /remove-lifecycle stale.
If this issue is safe to close now please do so with /close.
/lifecycle stale
Stale issues rot after 30d of inactivity.
Mark the issue as fresh with /remove-lifecycle rotten.
Rotten issues close after an additional 30d of inactivity.
If this issue is safe to close now please do so with /close.
/lifecycle rotten
Rotten issues close after 30d of inactivity.
Reopen the issue with /reopen.
Mark the issue as fresh with /remove-lifecycle rotten.
/close
@kubermatic-bot: Closing this issue.
In response to this:
Rotten issues close after 30d of inactivity. Reopen the issue with
/reopen. Mark the issue as fresh with/remove-lifecycle rotten./close
Instructions for interacting with me using PR comments are available here. If you have questions or suggestions related to my behavior, please file an issue against the kubernetes/test-infra repository.