Possible memory leak
I've added maloja to my uptime monitoring to check home page every minute and it killed my homelab completely.
Apr 24 09:49:59 nuc.northys.cz kernel: oom-kill:constraint=CONSTRAINT_NONE,nodemask=(null),cpuset=d922e8d4fcf01a86bd2d4>
Apr 24 09:49:59 nuc.northys.cz kernel: Out of memory: Killed process 758402 (Maloja) total-vm:7568084kB, anon-rss:75306>
Apr 24 09:49:59 nuc.northys.cz kernel: oom_reaper: reaped process 758402 (Maloja), now anon-rss:0kB, file-rss:0kB, shme>
root@nuc ~ # journalctl --since "12 hours ago" | grep -i maloja
Apr 24 01:48:16 nuc.northys.cz kernel: [ 740653]     0 740653  2182572  2172736 18059264        0             0 Maloja
Apr 24 01:48:16 nuc.northys.cz kernel: oom-kill:constraint=CONSTRAINT_NONE,nodemask=(null),cpuset=b97b7b6ba2230a8da6ff290af2fbe2c4aa566146c5564df9fbc79da815e194ed,mems_allowed=0,global_oom,task_memcg=/docker/ebc7ae2133b2684874f1f4036f4cb537b43291a5aa46c61de1e2f2b2adc02598,task=Maloja,pid=740653,uid=0
Apr 24 01:48:16 nuc.northys.cz kernel: Out of memory: Killed process 740653 (Maloja) total-vm:8730288kB, anon-rss:8690944kB, file-rss:0kB, shmem-rss:0kB, UID:0 pgtables:17636kB oom_score_adj:0
Apr 24 01:48:16 nuc.northys.cz kernel: oom_reaper: reaped process 740653 (Maloja), now anon-rss:0kB, file-rss:0kB, shmem-rss:0kB
Apr 24 09:49:59 nuc.northys.cz kernel: [ 758402]     0 758402  1892021  1882657 15622144        0             0 Maloja
Apr 24 09:49:59 nuc.northys.cz kernel: oom-kill:constraint=CONSTRAINT_NONE,nodemask=(null),cpuset=d922e8d4fcf01a86bd2d4062169a5a31ef69478b6eb9df7258cc348bb4fd2f4e,mems_allowed=0,global_oom,task_memcg=/docker/ebc7ae2133b2684874f1f4036f4cb537b43291a5aa46c61de1e2f2b2adc02598,task=Maloja,pid=758402,uid=0
Apr 24 09:49:59 nuc.northys.cz kernel: Out of memory: Killed process 758402 (Maloja) total-vm:7568084kB, anon-rss:7530628kB, file-rss:0kB, shmem-rss:0kB, UID:0 pgtables:15256kB oom_score_adj:0
Apr 24 09:49:59 nuc.northys.cz kernel: oom_reaper: reaped process 758402 (Maloja), now anon-rss:0kB, file-rss:0kB, shmem-rss:0kB
root@nuc ~ #
Hm, is that with cache enabled?
While this certainly doesn't fix the issue you could replace the homepage check with a call to /apis/mlj_1/serverinfo for now which at least avoids generating all the stats every minute.
Yup it's with cache enabled. I'll make coffee and dig more into syslog, graphs I have in prometheus and into logs produced by maloja.
Interesting it looks like kill log doesn't match time when maloja started.
root@nuc ~ # docker logs -t maloja | grep v3.0.5
2022-04-23T23:46:58.972536930Z Maloja v3.0.5
2022-04-24T02:50:15.541884298Z Maloja v3.0.5
2022-04-24T12:39:03.150876609Z Maloja v3.0.5
Some cache stats:
root@nuc ~ # docker logs -t maloja | grep 'dbcache\|sqldb'
2022-04-23T23:46:58.972575813Z [dbcache] Cache Size: 53 [83061 E], System RAM Utilization: 29.4%, Cache Hits: 21/76
2022-04-23T23:46:58.972577860Z [sqldb] Database Cleanup...
2022-04-23T23:46:58.972579796Z [sqldb] Database Cleanup complete!
2022-04-23T23:46:58.972610400Z [dbcache] Invalidated 208 of 1478 DB cache entries
2022-04-23T23:46:58.972636355Z [dbcache] Invalidated 177 of 1458 DB cache entries
2022-04-23T23:46:58.972665286Z [dbcache] Invalidated 174 of 1475 DB cache entries
2022-04-23T23:46:58.972684353Z [dbcache] Invalidated 173 of 1486 DB cache entries
2022-04-23T23:46:58.972704447Z [dbcache] Invalidated 176 of 1501 DB cache entries
2022-04-23T23:46:58.972720603Z [dbcache] Invalidated 176 of 1509 DB cache entries
2022-04-23T23:46:58.972761206Z [dbcache] Invalidated 174 of 1523 DB cache entries
2022-04-24T02:50:15.541920474Z [dbcache] Cache Size: 0 [0 E], System RAM Utilization: 35.7%, Cache Hits: 0/1
2022-04-24T02:50:15.541922612Z [sqldb] Database Cleanup...
2022-04-24T02:50:15.541924669Z [sqldb] Database Cleanup complete!
2022-04-24T02:50:15.541974189Z [dbcache] Cache Size: 1390 [85200 E], System RAM Utilization: 54.0%, Cache Hits: 1471/2861
2022-04-24T02:50:15.541978579Z [sqldb] Database Cleanup...
2022-04-24T02:50:15.541980787Z [sqldb] Database Cleanup complete!
2022-04-24T03:58:45.701377892Z [dbcache] Cache Size: 1610 [85200 E], System RAM Utilization: 97.6%, Cache Hits: 10216/11826
2022-04-24T03:58:45.701381009Z [dbcache] 97.6% RAM usage, clearing cache and adjusting size!
2022-04-24T03:58:45.701384002Z [dbcache] Cache Size: 0 [85200 E], System RAM Utilization: 61.4%, Cache Hits: 10216/11826
2022-04-24T03:58:45.701387013Z [sqldb] Database Cleanup...
2022-04-24T03:58:45.701390028Z [sqldb] Database Cleanup complete!
2022-04-24T05:02:53.333925605Z [dbcache] Cache Size: 419 [85200 E], System RAM Utilization: 82.9%, Cache Hits: 18842/20871
2022-04-24T05:02:53.333928084Z [dbcache] 82.9% RAM usage, clearing cache and adjusting size!
2022-04-24T05:02:53.333930529Z [sqldb] Database Cleanup...
2022-04-24T05:02:53.333932849Z [dbcache] Cache Size: 0 [85200 E], System RAM Utilization: 64.8%, Cache Hits: 18842/20871
2022-04-24T05:02:53.333935241Z [sqldb] Database Cleanup complete!
2022-04-24T05:02:53.334225089Z [dbcache] Cache Size: 419 [85200 E], System RAM Utilization: 85.0%, Cache Hits: 27468/29916
2022-04-24T05:02:53.334227148Z [dbcache] 85.0% RAM usage, clearing cache and adjusting size!
2022-04-24T05:02:53.334229237Z [dbcache] Cache Size: 0 [85200 E], System RAM Utilization: 71.9%, Cache Hits: 27468/29916
2022-04-24T05:02:53.334231308Z [sqldb] Database Cleanup...
2022-04-24T05:02:53.334233279Z [sqldb] Database Cleanup complete!
2022-04-24T06:09:06.405374898Z [dbcache] Cache Size: 419 [85200 E], System RAM Utilization: 86.3%, Cache Hits: 36094/38961
2022-04-24T06:09:06.405395046Z [dbcache] 86.3% RAM usage, clearing cache and adjusting size!
2022-04-24T06:09:06.405397174Z [dbcache] Cache Size: 0 [85200 E], System RAM Utilization: 76.0%, Cache Hits: 36094/38961
2022-04-24T06:09:06.405401026Z [sqldb] Database Cleanup...
2022-04-24T06:09:06.405403190Z [sqldb] Database Cleanup complete!
2022-04-24T07:16:26.622791718Z [dbcache] Cache Size: 419 [85200 E], System RAM Utilization: 88.5%, Cache Hits: 44720/48006
2022-04-24T07:16:26.622794466Z [dbcache] 88.5% RAM usage, clearing cache and adjusting size!
2022-04-24T07:16:26.622797340Z [sqldb] Database Cleanup...
2022-04-24T07:16:26.622802065Z [dbcache] Cache Size: 0 [85200 E], System RAM Utilization: 80.0%, Cache Hits: 44720/48006
2022-04-24T07:16:26.622805428Z [sqldb] Database Cleanup complete!
2022-04-24T08:22:45.412525863Z [dbcache] Cache Size: 423 [85200 E], System RAM Utilization: 91.3%, Cache Hits: 53505/57214
2022-04-24T08:22:45.412528802Z [dbcache] 91.3% RAM usage, clearing cache and adjusting size!
2022-04-24T08:22:45.412531598Z [sqldb] Database Cleanup...
2022-04-24T08:22:45.412534412Z [dbcache] Cache Size: 0 [85200 E], System RAM Utilization: 82.8%, Cache Hits: 53505/57214
2022-04-24T08:22:45.412537681Z [sqldb] Database Cleanup complete!
2022-04-24T12:39:03.150949221Z [sqldb] Database Cleanup...
2022-04-24T12:39:03.150954485Z [dbcache] Cache Size: 0 [74622 E], System RAM Utilization: 16.2%, Cache Hits: 0/1
2022-04-24T12:39:03.150959959Z [sqldb] Database Cleanup complete!
2022-04-24T12:39:03.151105142Z [dbcache] Cache Size: 1384 [85200 E], System RAM Utilization: 33.4%, Cache Hits: 994/2378
2022-04-24T12:39:03.151109952Z [sqldb] Database Cleanup...
2022-04-24T12:39:03.151114572Z [sqldb] Database Cleanup complete!
2022-04-24T12:39:03.151154900Z [dbcache] Invalidated 164 of 1399 DB cache entries
2022-04-24T12:39:03.151174659Z [dbcache] Invalidated 157 of 1396 DB cache entries
2022-04-24T12:39:03.151199949Z [dbcache] Invalidated 158 of 1397 DB cache entries
2022-04-24T12:39:03.151211066Z [dbcache] Invalidated 3 of 1242 DB cache entries
2022-04-24T12:39:03.151230721Z [dbcache] Invalidated 148 of 1391 DB cache entries
2022-04-24T12:39:03.151250060Z [dbcache] Invalidated 147 of 1394 DB cache entries
2022-04-24T12:39:03.151269510Z [dbcache] Invalidated 142 of 1393 DB cache entries
2022-04-24T12:39:03.151280758Z [dbcache] Invalidated 3 of 1254 DB cache entries
Looks like it took only 2 hours to consume about 8GB of RAM. I think it should be easy to reproduce the leak.
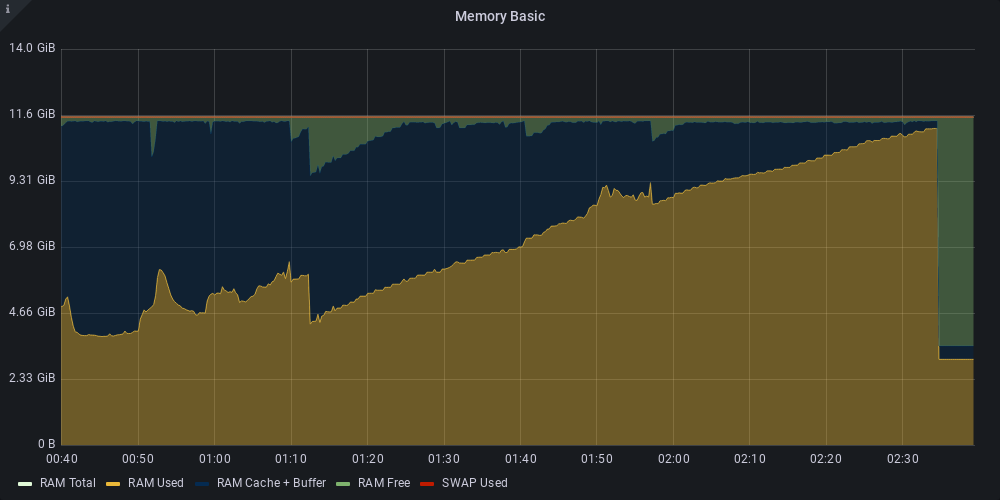
Alright, have reproduced it, now working on profiling memory use... this will take some time.
I wonder whether the cache is used later? Because I haven't scrobbled a single song during the night and my sqlite database is only 30MB big.
I understand that it is CPU consuming to calculate all those SUMs but now it feels like the homepage cache is created every request instead of page being server instantly because stats should be already in the cache.
This issue maybe could be called "same results are being cached over and over again" instead of "cache memory leak".
What do you think?
Also - do you use some kind of cache implemented by yourself or some kind of "redis" as a python library?
I can only guess that when memory usage gets too high, the cache is expelled, but somehow some references remain, meaning the OS can't reclaim that memory. Then, on the next generation of the homepage, the cache will be filled again with the same data because the actual cache doesn't reference it anymore - so it's indeed the same data over and over again, just not referenced properly. I'm probably gonna disable the cache per default for now until I have more time to profile this properly.
The cache is using the lru-dict library with the caching logic implemented myself.
Okay, I've pushed a new version. The homepage should now no longer cause RAM usage to go out of control. It still doesn't really explain why the cache expulsion didn't trigger, but at least pinging your homepage should now be safe (and also much more performant as a nice side effect).
It still doesn't really explain why the cache expulsion didn't trigger
Has that happened also for you?
I could explain that to myself as my homepab has only 12GB of memory and running a lot of stuff. E.g. every hour it runs 20 rsync and one restic.io backup which loads some backup repository index into memory. This index may have like 2GB which causes system to go into OOM state and OOM killer took maloja down before it could realize that it may clear cache. Wouldn't that make sence?
That's possible I suppose. I'll see if I can make the cache clearing a bit more proactive in the future.
Since maloja is single user application I would set some hardcoded limit for cache. My database has 50MB at most so I would expect that 512MB for cache si just too much. I would set the cache limit to 256MB or maybe even 128MB.
The lru_dict structure doesn't support that unfortunately (and it's also somewhat hard to estimate the memory use of an object that consists of pointers), so I have to actively clear the cache depending on memory use. The entries can be quite big compared to the raw DB size, so there's definitely a performance benefit of having 512MB or more - and if the RAM is available on the system, it should be used after all, as lots of empty RAM doesn't do anything. I've settled for now on cache clearance at 40% total RAM use (overwritable by user setting) plus some extra log output - let's see how it performs.
I've just upgraded to latest version and homepage is much faster. Good job!
as lots of empty RAM doesn't do anything
That's true but I would be more happy if system could use that free ram for filesystem cache rather than to waste it by a program which uses half of my RAM to cache some data I access twise a week.
overwritable by user setting
great!