XChart
 XChart copied to clipboard
XChart is a light-weight Java library for plotting data.
when max value is lower than 0, but tick value always begin at 0. thank you. 

Is there a way to optimize the methods of the BitmapEncoder class? They are extremely costly; a graph with 50k points takes over 2 seconds to save when calling saveBitmap(List)....
I updated the version from 3.6.4 to 3.8.1 and found that some methods were deleted。 Does it work differently now? Method of disappearance: - AxesChartSeries.setToolTips(String[] toolTips) - AxesChartSeries.setCustomToolTips(boolean isCustomToolTips) -...
fmt-maven-plugin has moved, see https://github.com/spotify/fmt-maven-plugin
Hi, SelectionZoom and several other handful measurement functions are no longer accessible in the latest version (3.8.1). I am developing a data acquisition software and I use xchart v3.6.4 to...
Does XChart > Area charts support 'stacked' feature? At present, there is an overlap between layers and that kind of disturb the colour of layers. I am looking to achieve...
I'm trying to format my x-axis ticks and I found #217 which seems to answer my problems. However, it seems that the method customTickCalculator is not usable on 3.8.1 for...
Bumps [maven-jar-plugin](https://github.com/apache/maven-jar-plugin) from 3.2.0 to 3.2.2. Commits d37e995 [maven-release-plugin] prepare release maven-jar-plugin-3.2.2 7bb0bfc [MJAR-284] Remove override for Plexus Archiver a3e424d [MJAR-283] Upgrade Plexus Utils to 3.3.1 95bc15b [maven-release-plugin] prepare for...
The y-axis is incorrect for category chart when using line rendering style. The chart becomes correct if the y-axis min is explicitly set to 0 i.e. x chart.getStyler().setYAxisMin(0.0). If the...
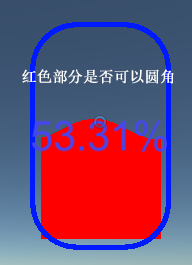
**Can the red part be rounded**