XChart

XChart copied to clipboard
Grid line issues when using AxesChartStyler.setPlotGridLinesStroke
Since XChart 3.3.0 the grid lines appear multiple times when customizing them with AxesChartStyler.setPlotGridLinesStroke.
It can be reproduced using the small example program below:
package example;

import java.awt.BasicStroke;
import java.awt.Dimension;
import java.awt.Graphics;
import java.awt.Graphics2D;
import java.awt.event.WindowAdapter;
import java.awt.event.WindowEvent;

import javax.swing.JFrame;
import javax.swing.JPanel;

import org.knowm.xchart.XYChart;
import org.knowm.xchart.XYChartBuilder;

public class ChartTest {

    private static class ChartPanel extends JPanel {

        private static final long serialVersionUID = 1L;

        @Override
        public void paint(Graphics g) {
            XYChart chart = new XYChartBuilder().width(getWidth()).height(getHeight()).build();
            chart.getStyler().setPlotGridLinesStroke(new BasicStroke((float) 3.125, BasicStroke.CAP_BUTT,
                    BasicStroke.JOIN_BEVEL, 10, new float[] { 6.25f, 6.25f }, 0));
            chart.paint((Graphics2D) g, chart.getWidth(), chart.getHeight());
        }
    }

    public static void main(String s[]) {
        JFrame frame = new JFrame();
        frame.getContentPane().add("Center", new ChartPanel());
        frame.pack();
        frame.setSize(new Dimension(500, 300));
        frame.setVisible(true);
        frame.setTitle("Chart Test");
        frame.addWindowListener(new WindowAdapter() {
            @Override
            public void windowClosing(WindowEvent e) {
                System.exit(0);
            }
        });
    }

}
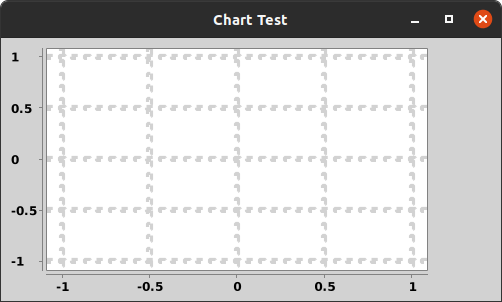
These are the resulting grid lines when running this program using XChart 3.8.1:
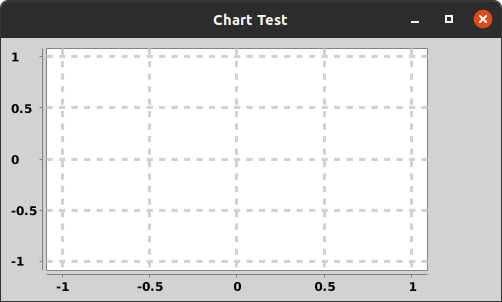
If I run the same program using XChart 3.1.0 the grid lines look normal:
It seems the issues started with XChart 3.2.0 where the grid lines are not filled:

The change log also mentions there was a fix for this in 3.3.0, but it looks like the fix had some side effects.
I've tested this on Java 11, Ubuntu 20.04.3