Bug on CategoryStyler generating Area type charts
Description According to the charts offered by the library, when generating one of the Area type, the expected result does not match the one generated.
The issue is reproducible in: Module Version: xchart.3.8.1 OS Version etc: Ubuntu 20.04.4 LTS
The steps to reproduce are:
Define a new CategoryChart
Set the CategorySeriesRenderStyle as an Area type.
final CategoryChart chart = new CategoryChartBuilder().width(chartWrapper.chartDimensions.get(1))
.height(chartWrapper.chartDimensions.get(0)).build();
...
chart.getStyler().setPlotGridLinesColor(Color.GRAY);
chart.getStyler().setYAxisDecimalPattern(PATTERN);
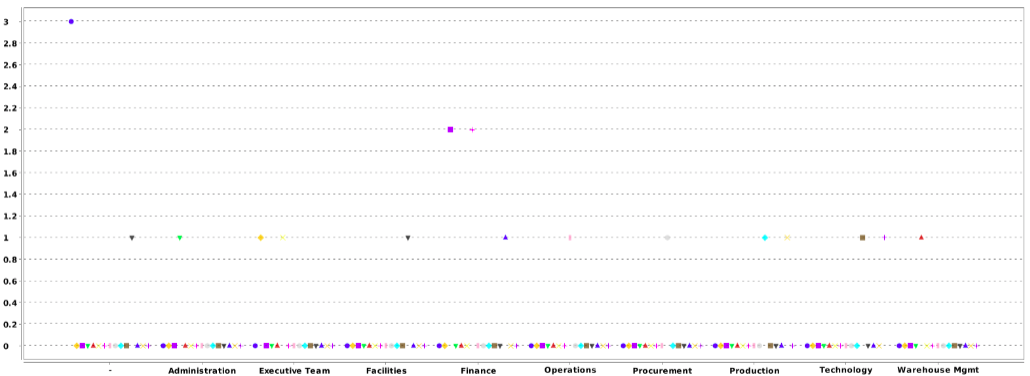
chart.getStyler().setDefaultSeriesRenderStyle(CategorySeries.CategorySeriesRenderStyle.Area);
The expected result is:
 Show a chart with the area below the boundary colored
The actual results is:
Show a chart with the area below the boundary colored
The actual results is:
It does not generate any error other than the visible one, a solution found is presented in the Plot_Category class as indicated by the attached .txt
xchart_3_8_1.txt
I've searched for any related issues and avoided creating a duplicate issue, thanks.
Instead of attaching a patch file, I suggest you create a Pull Request toward the repository.