Max Kanter
Max Kanter
This source has zonal load forecasts and the historical forecasts that were made. the zonal forecast sum to the area wide forecast that is shown on iso express chart https://www.iso-ne.com/isoexpress/web/reports/load-and-demand/-/reports/three-day-reliability-region-demand-forecast?p_auth=PxfXpuUU
```python >>> import gridstatus >>> iso = gridstatus.ISONE() >>> iso.get_pnode_table("latest") Publish Date Substation Long Name Substation Name Unit Name Unit Short Name Node Name Node/Unit ID Zone ID Reserve ID...
Needs clean up still. Make graphs like this 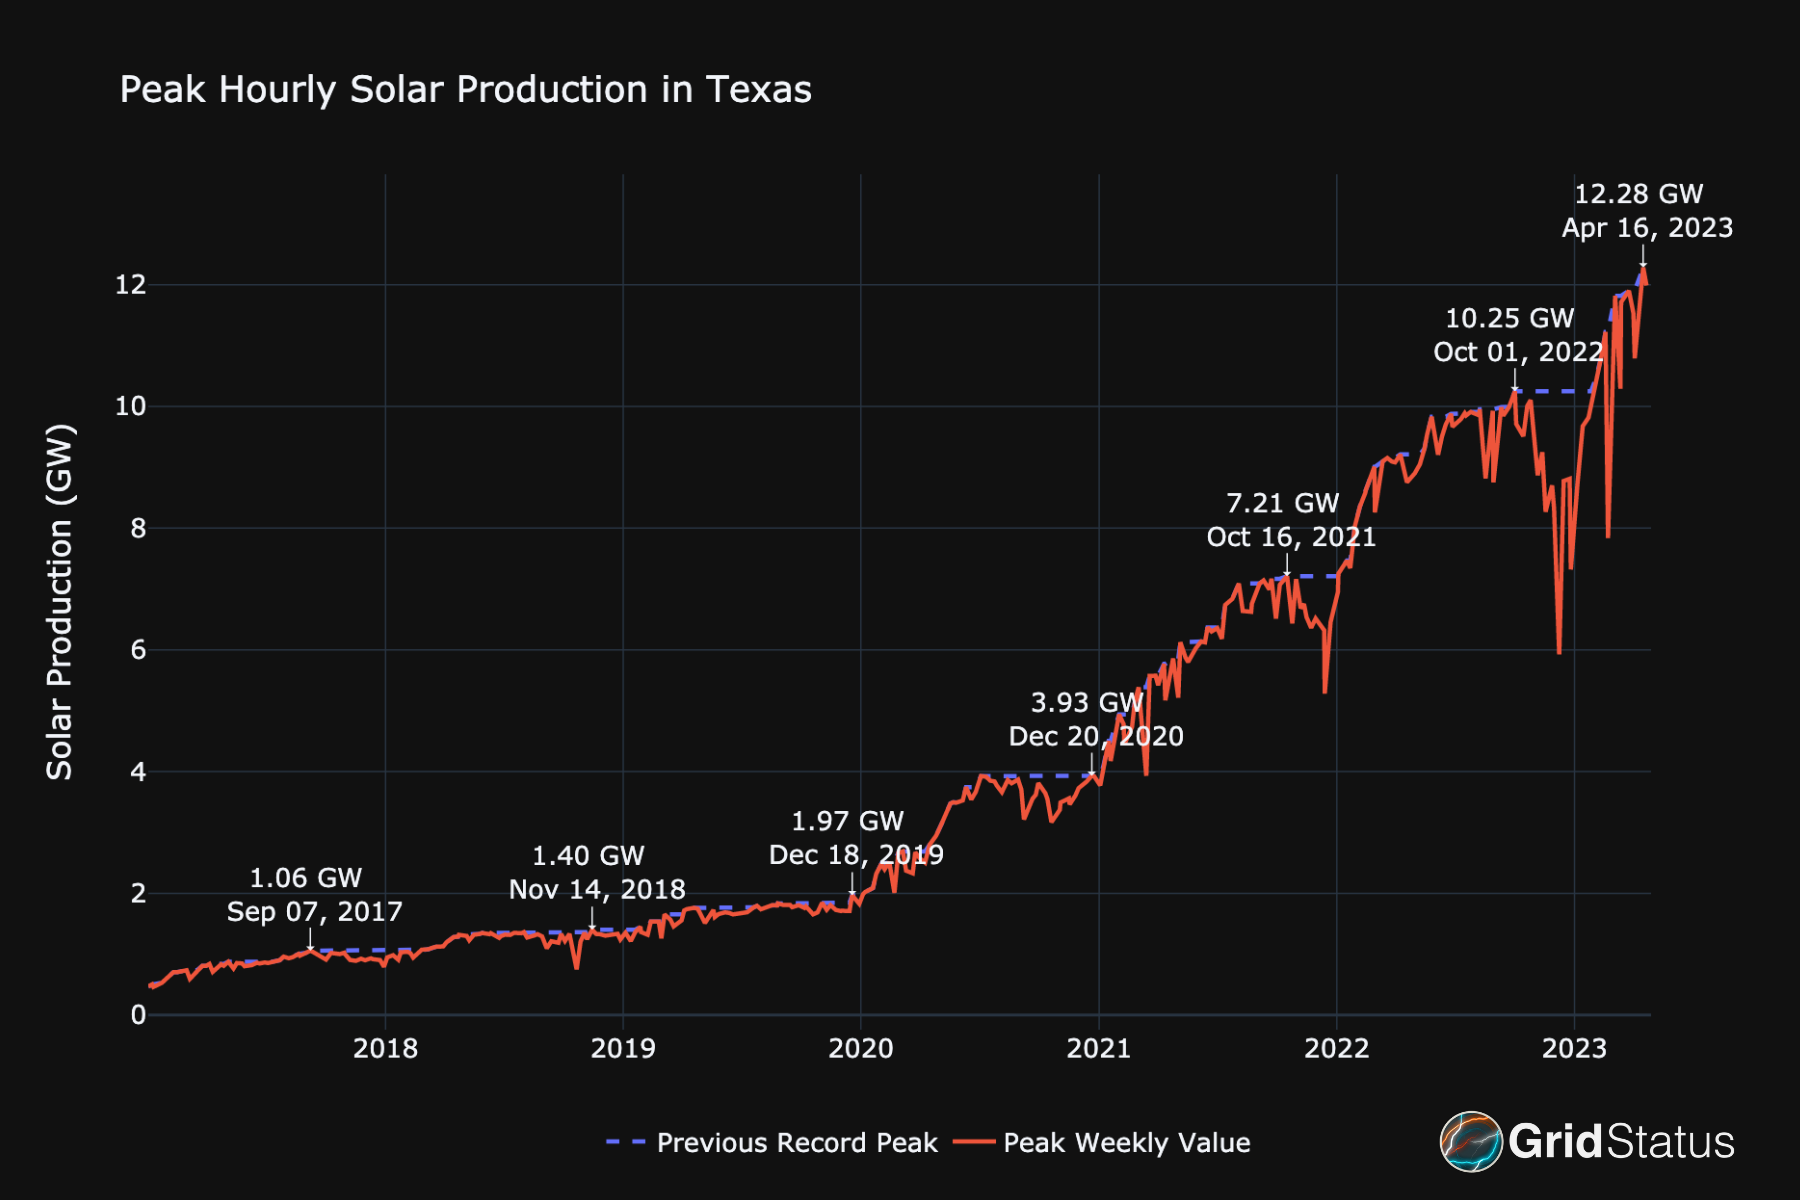
EIA client added in #216. Add some example to documentation

Data as as early as 1995: https://www.ercot.com/gridinfo/load/load_hist
The ISOs have no standard when it comes to labeling time intervals based on the beginning, the end, or both. In order to avoid any confusion, all methods should be...
Some ISO publish forecasts of Solar and Wind. ### ERCOT [NP4-732-CD - Wind Power Production - Hourly Averaged Actual and Forecasted Values](https://www.ercot.com/mp/data-products/data-product-details?id=NP4-732-CD) [NP4-742-CD - Wind Power Production - Hourly Averaged...
Currently, the plotly graphs in documentation that are part of `ipynb` files are showing as SVGs. it should be possible to make them interactive. Interactive graphs are working in index.md...
Realtime market: http://mis.nyiso.com/public/P-6Blist.htm Day Ahead: http://mis.nyiso.com/public/P-5list.htm
Need to do work filling out sources ## Data Source ### MISO ### ISONE - [Short Term Report](https://www.iso-ne.com/isoexpress/web/reports/operations/-/tree/short-trm-out-rpt) - [Long Term Report](https://www.iso-ne.com/isoexpress/web/reports/operations/-/tree/long-trm-out-rpt) ### NYISO - [Available Datasets](http://mis.nyiso.com/public/) ### SPP ###...