backtesting.py
 backtesting.py copied to clipboard
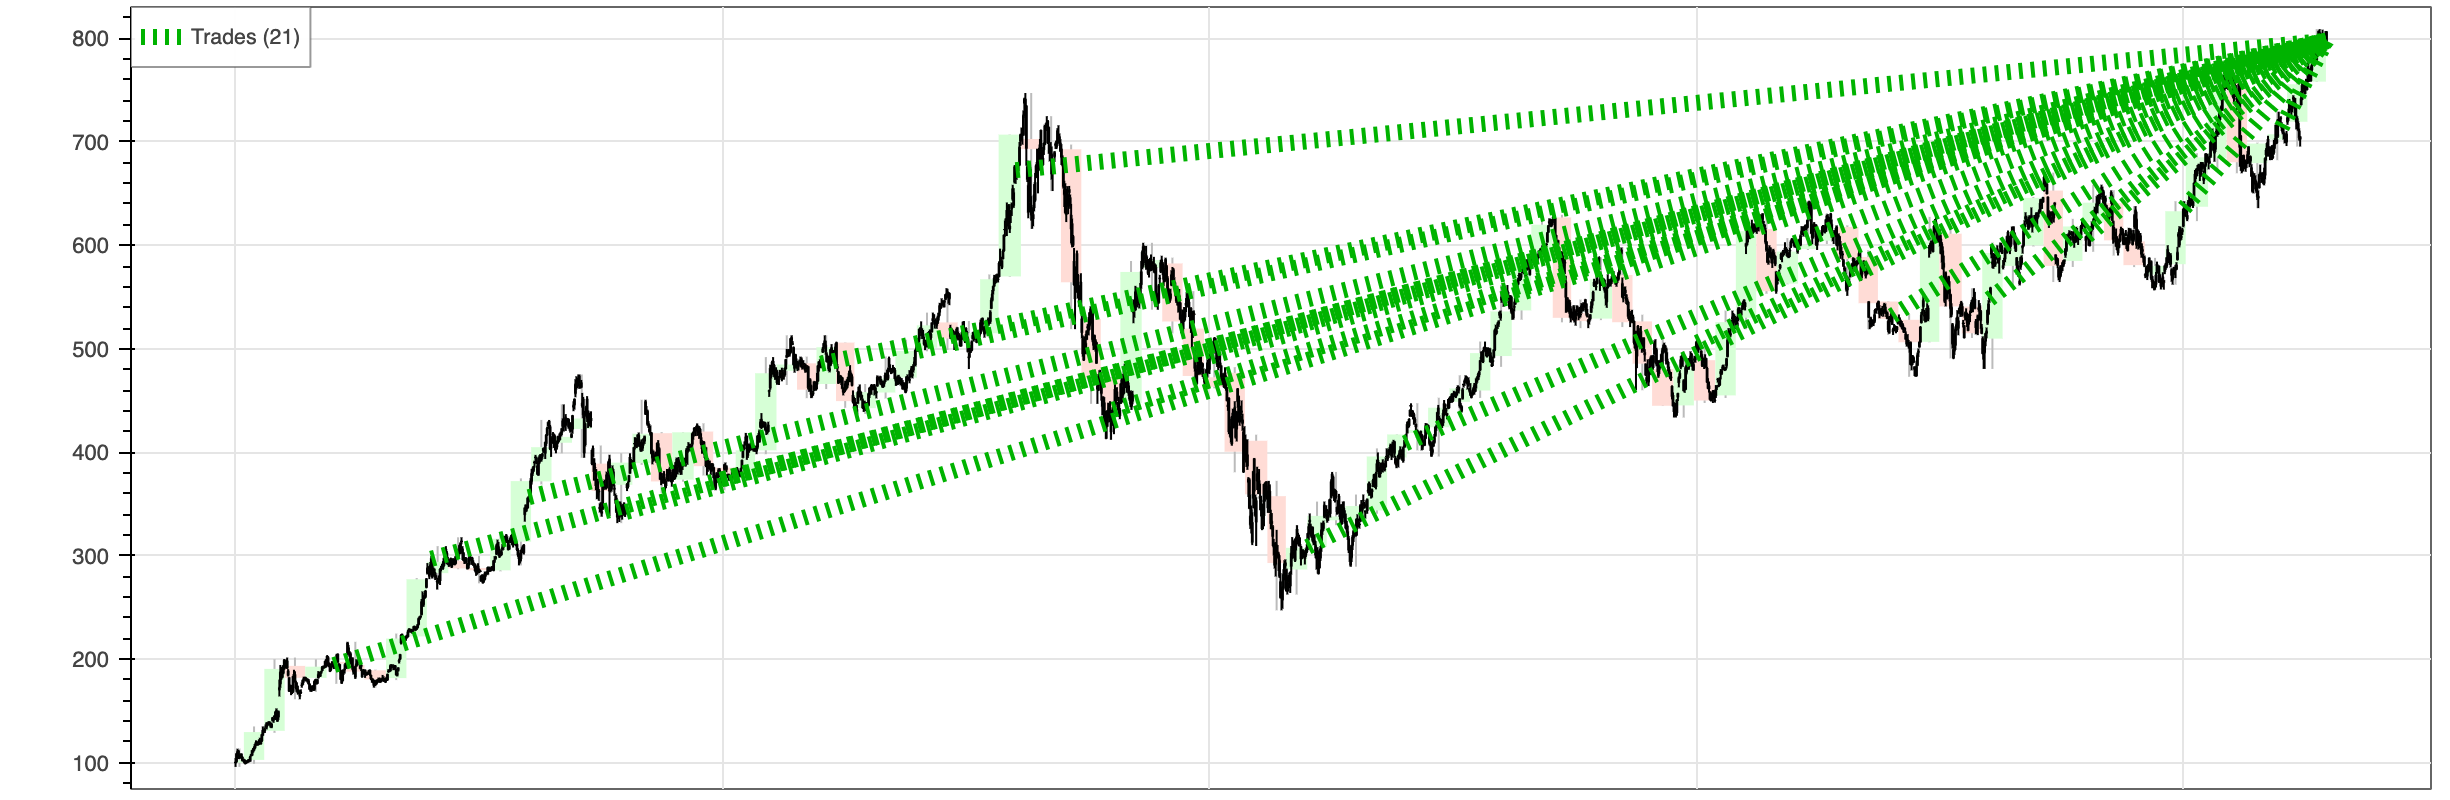
anomalous trade plot from simple Dollar Cost Averaging code
Expected Behavior
3-4 buy trades indicated per year at the level they were bought at
Actual Behavior

Steps to Reproduce
from backtesting import Strategy
from backtesting import Backtest

class DCA(Strategy):
    buy_dollars = 1000
    buy_period = 100
    count = 0
    cash_total = 0

    def init(self):
        self.cash_total = self.equity

    def next(self):
        self.count += 1
        if not (self.count % self.buy_period):
            cash_left = self.cash_total - sum(t.entry_price*t.size for t in self.trades)
            if (self.buy_dollars >= self.data.Close[-1]):
                self.buy(size=self.buy_dollars // self.data.Close[-1])

bt = Backtest(GOOG, DCA, cash=100_000, commission=0)
bt.run()
bt.plot()
Additional info
- Backtesting version: 0.3.3
Ah maybe I'm misunderstanding how these indicators work... I thought the green hash marks are supposed to appear at the time of the buy and be along the price line. Whats the intended function of all of the extra hash marks?
If I increase this to say 26 buys per year, the chart is unreadable. Is there a way to change or suppress this behavior that may be more appropriate for a DCA kind of test?
Indeed, the dotted tractor beams indicate trade durations and are currently non-optional: https://github.com/kernc/backtesting.py/blob/65f54f6819cac5f36fd94ebf0377644c62b4ee3d/backtesting/_plotting.py#L489-L496 In simple DCA test runs, you might skip plotting them? :stuck_out_tongue:
Could do. Wanted to just get a visual feel for when my buys are happening. DCA is just a dummy stand in for a more complex family of iterative buy and hold strategies. Thx for being so responsive here. I may wind up forking and making that simple functionality