datadash
 datadash copied to clipboard
Visualize and graph data in the terminal
dataDash
Visualize streaming or tabular data inside the terminal
Description
A graphing application written in go using termdash, inspired by termeter. Delimited Data can be passed in by pipe or directly from a file.
Chart types
datadash currently supports following chart types:
- Line
- Plot tabular or streaming data as line graph
- Line graph supports zooming with the scroll wheel or trackpad
- Supports X-Axis Auto scaling
- Displays the average value with the -a option (customize how many values to consider using -z)
- Different color lines for each graph
- Supports scrolling for streaming data applications (disable with the --no-scroll option)
- Displays up to five graphs simultaneously
- Displays Min, Mean, Max, and Outliers
- Customize the screen redraw interval and input seek interval for high latency or low bandwidth environments
- No dependencies, only one file is required
- Sample datasets included
- Bar
- Support for Bar Graphs (Beta)
- SparkLine
- Support for SparkLine Graphs (Beta)
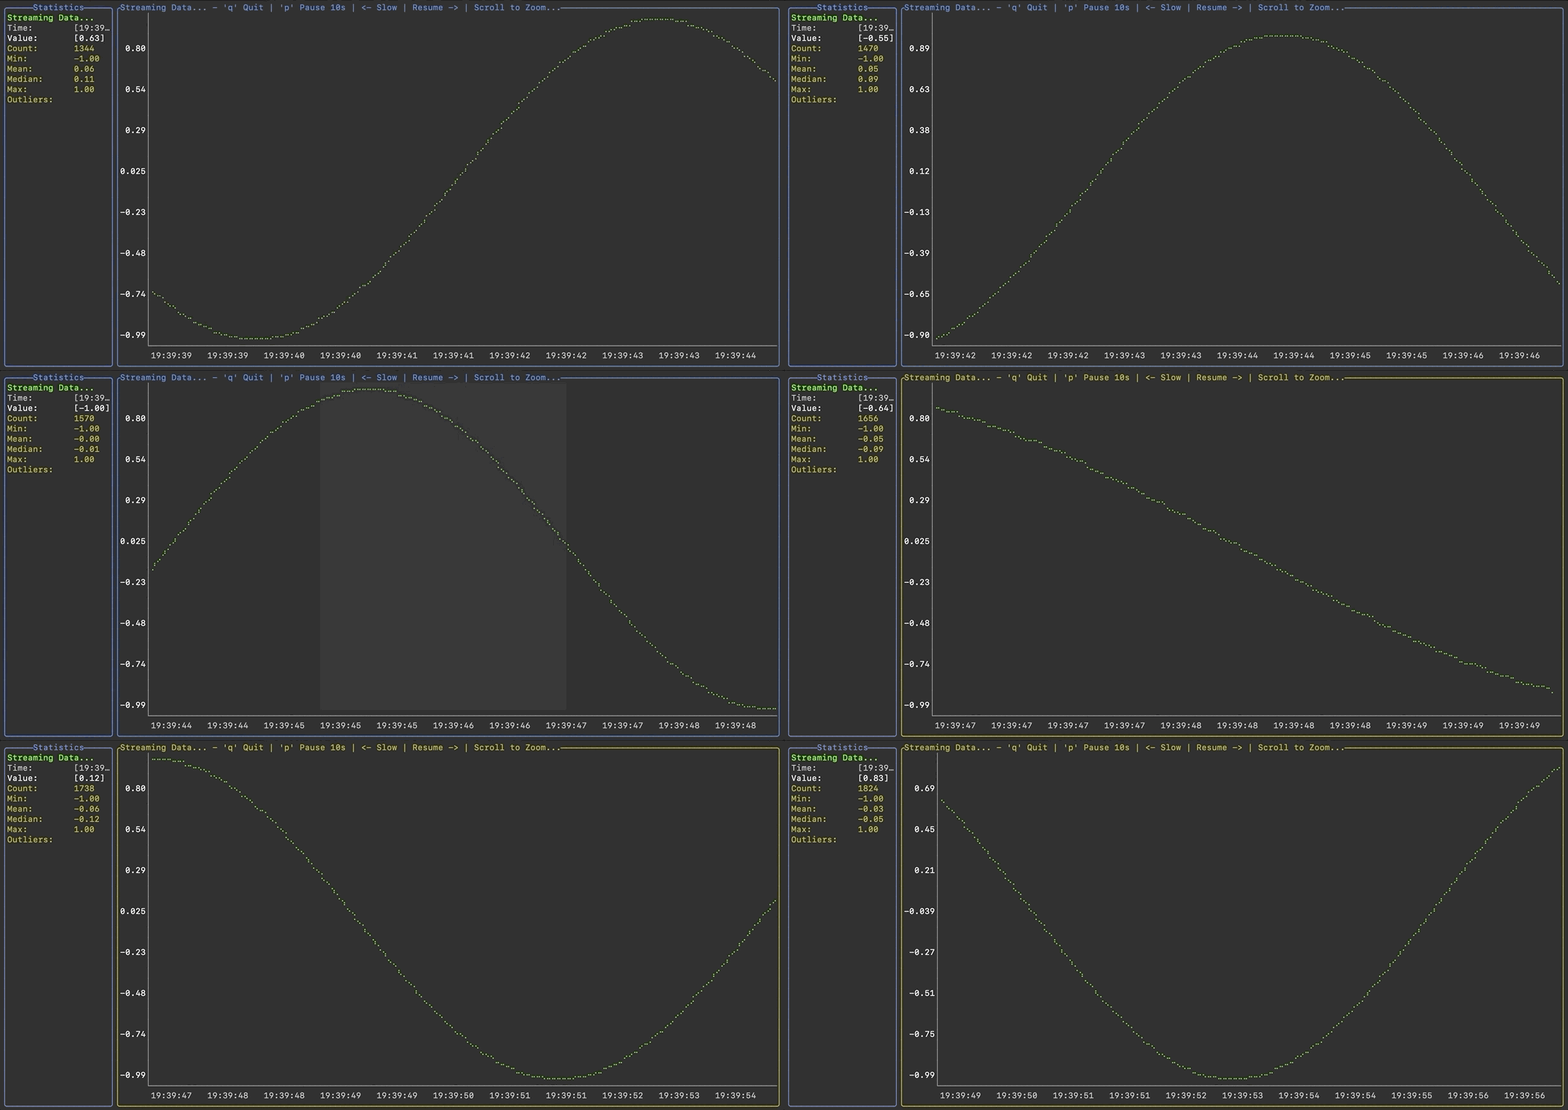
Streaming Data: (Linechart)

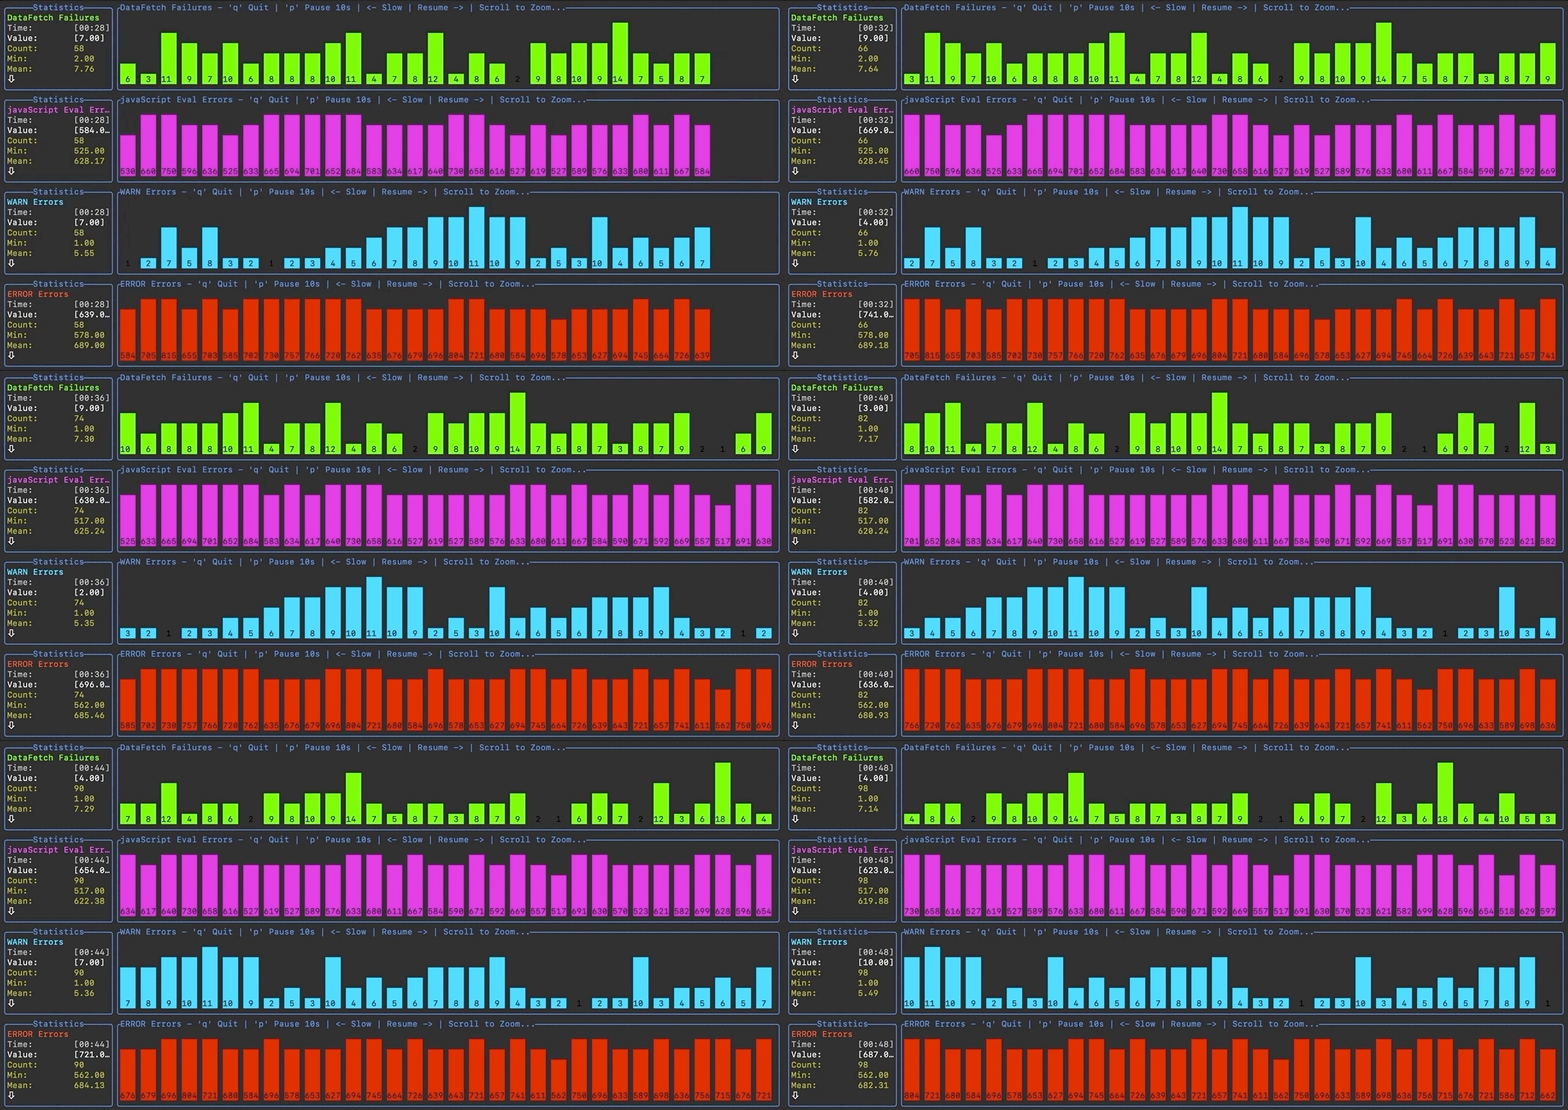
Streaming Data: (Barchart)

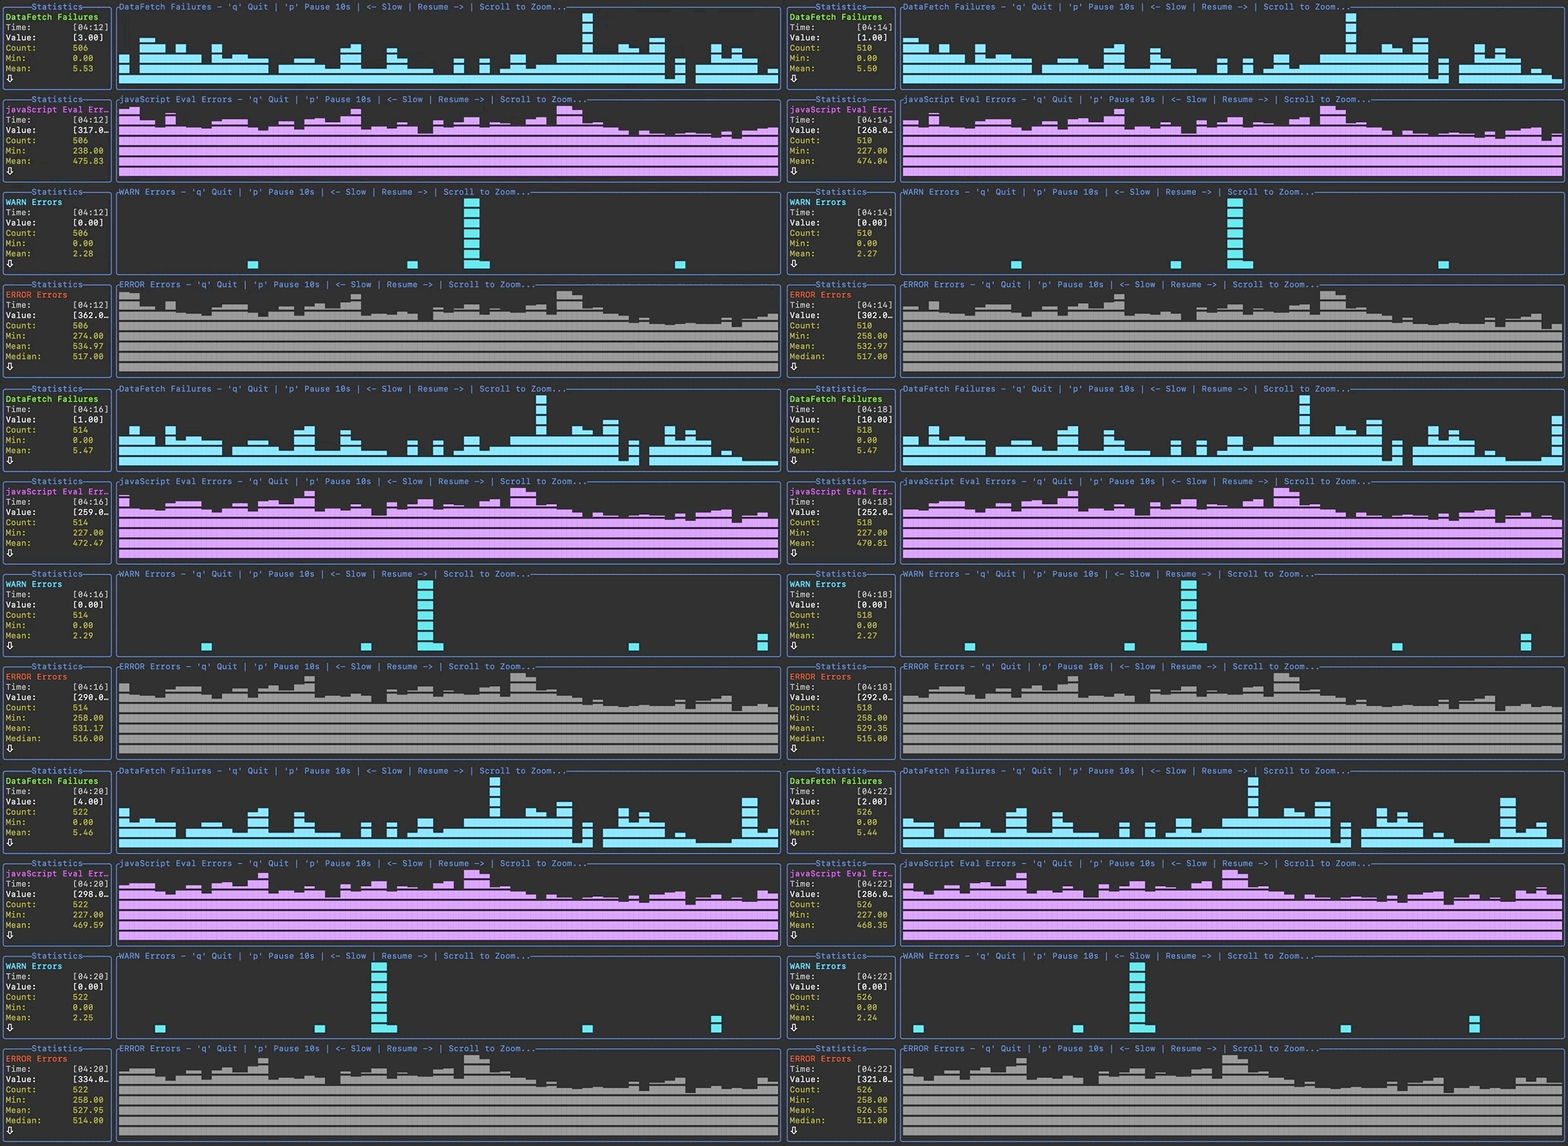
Streaming Data: (SparkLines)

Demo (Streaming data):
$ seq 4000 | awk 'BEGIN{OFS="\t"; print "x"}{x=$1/10; print x system("sleep 0.02")}' | ./datadash --label-mode time
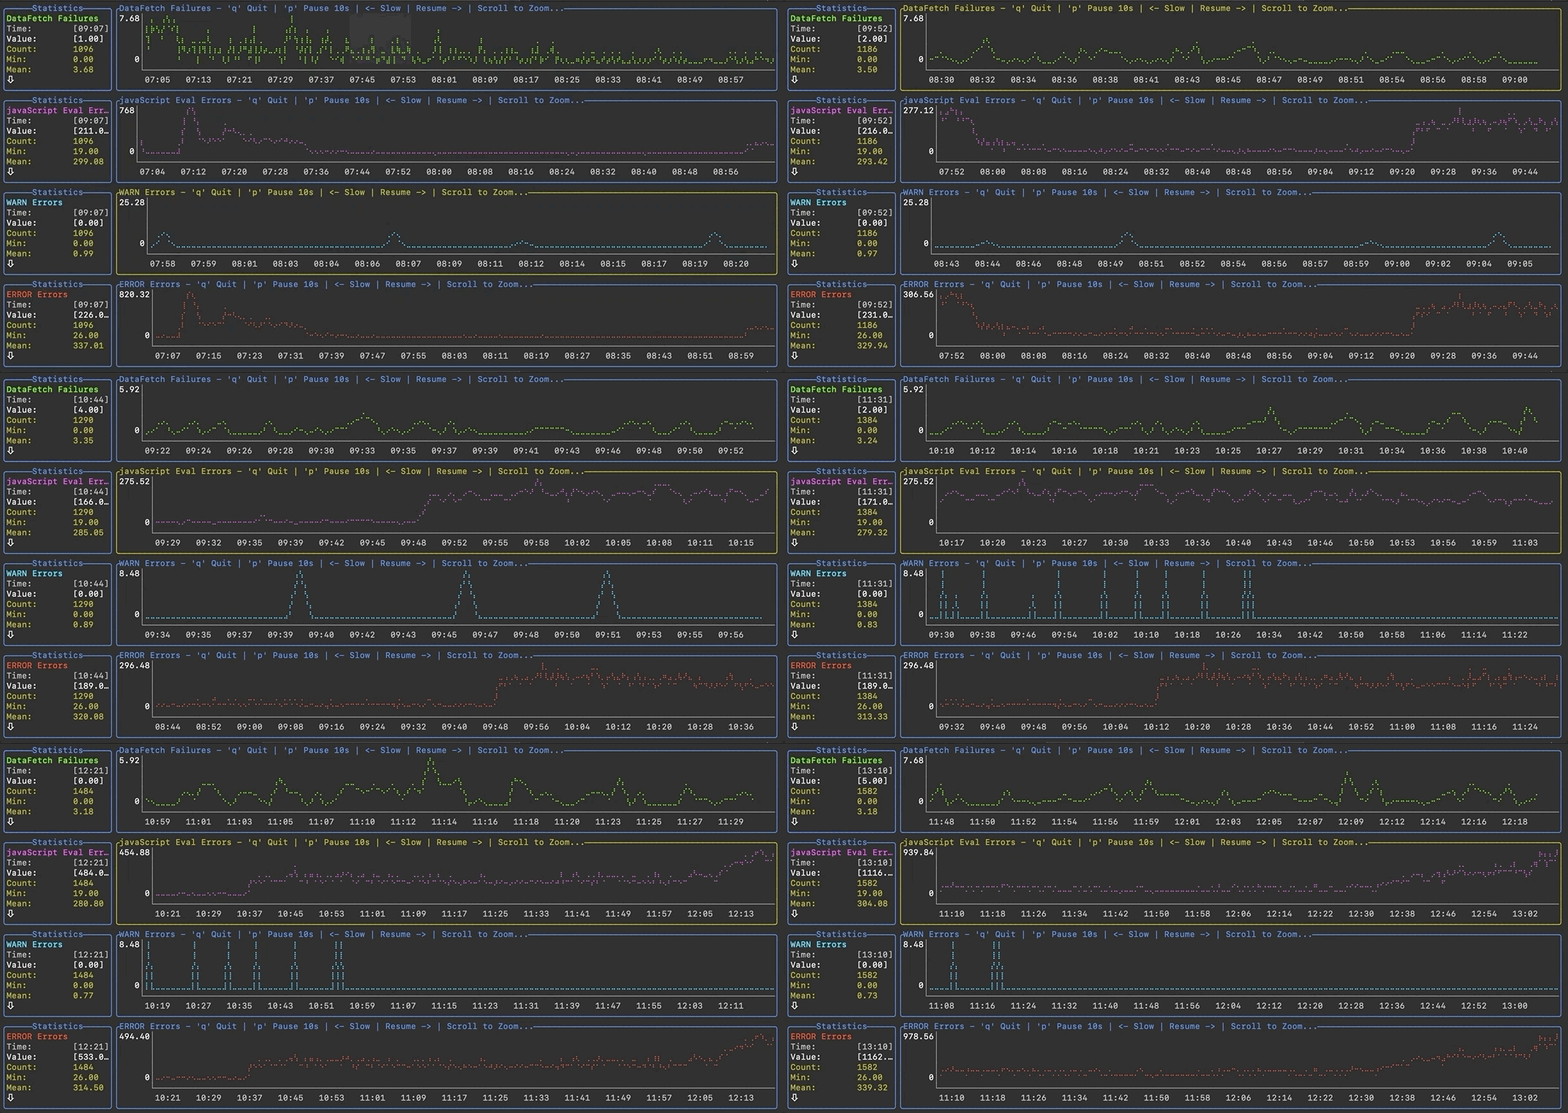
Tabular Data:

Demo: (2 columns of data):
$ seq 4000 | awk 'BEGIN{OFS="\t"; print "x","sin(x)"}{x=$1/10; print x,sin(x); system("sleep 0.02")}' | ./datadash --label-mode time
Demo: (6 columns of data):
$ seq 4000 | awk 'BEGIN{OFS="\t"; print "x","sin(x)","cos(x)", "rand(x)", "rand(x)", "rand(x)"}{x=$1/10; print x,sin(x),cos(x),rand(x),rand(x),rand(x); system("sleep 0.02")}' | ./datadash
Installation
$ go get -u github.com/keithknott26/datadash
datadash can accept tabular data like CSV, TSV, or you can use a custom delimiter with the -d option. The default delimiter is tab.
Input Methods
Input data from stdin or file.
$ cat data.txt | datadash
$ datadash data.txt
Data Structure
Below are examples of the accepted data structure. More examples can be found under /tools/sampledata
Streaming Data (1 graph):
50
60
70
3 Columns (2 graphs): (\t is the tab charachter)
time\tRowLabel1\tRowLabel2
00:00\t50\t100
00:01\t60\t90
00:02\t70\t80
00:08\t80\t70
23:50\t10\t10
Arguments
$ usage: datadash [<flags>] [<input file>]

A Data Visualization tool for the terminal

Flags:
      --help                  Show context-sensitive help (also try --help-long and --help-man).
      --debug                 Enable Debug Mode
  -d, --delimiter="\t"        Record Delimiter:
  -m, --label-mode="first"    X-Axis Labels: 'first' (use the first record in the column) or 'time' (use the current time)
  -s, --scroll                Whether or not to scroll chart data
  -a, --average-line          Enables the line representing the average of values
  -z, --average-seek=500      The number of values to consider when displaying the average line: (50,100,500...)
  -r, --redraw-interval=10ms  The interval at which objects on the screen are redrawn: (100ms,250ms,1s,5s..)
  -l, --seek-interval=20ms    The interval at which records (lines) are read from the datasource: (100ms,250ms,1s,5s..)

Args:
  [<input file>]  A file containing a label header, and data in columns separated by delimiter 'd'. Data piped from Stdin uses the same format
License
MIT