Kamon
 Kamon copied to clipboard
Unrelated spans in the same trace
Recently we started using Kamon for traces and it has been working great with very low effort.
One thing has created some confusion. We have a /health endpoint that simply returns an Ok with some text message. It does not interact with anything in the app.
What is weird here is that in some traces we have spans inside this request that are doing queries.
I am assuming there is some issue in identifying the thread or in the saved context. @ivantopo any ideas if it can be something we are doing wrong? Or where to look?
Hey @rtfpessoa, nice to see you around!
Most of the time this happens because of "dirty threads". That's when some instrumentation stores a context in a thread, but doesn't clean up afterwards. After a thread was left dirty, the next operation executing on the same thread will continue with the same context that is already "current", instead of creating a new one with a fresh Span. That's how you get the mixed traces you are seeing.
I think the Debug context storage can help you out with this. The Debug context storage keeps track of all Threads where a Context was ever stored, along with a stacktrace of the last update it has seen. In the ideal case, all Threads should have an empty context after you are done processing all requests. If you see something else, the stacktrace should help figure out what's wrong.
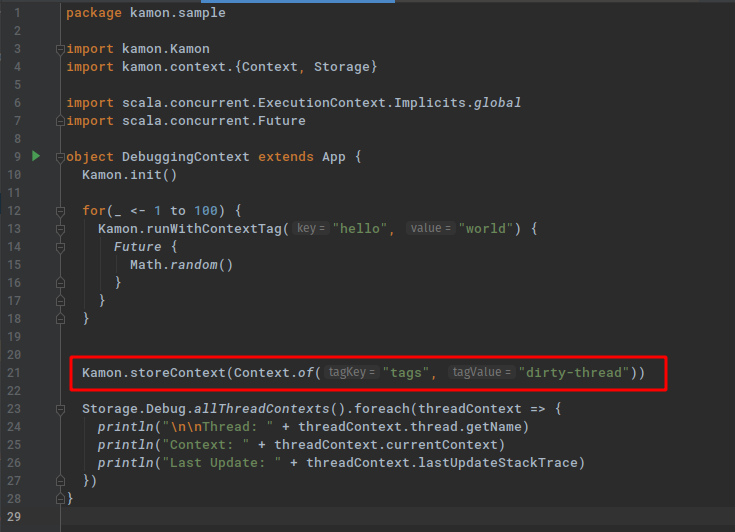
The only way to enable the debug context is by starting the JVM with the -Dkamon.context.debug=true option. Then you can access all the thread contexts via the kamon.context.Storage.Debug object. The object only keeps the states, you will need to do something with them. I usually have code like this to dump all data to stdout:
  Storage.Debug.allThreadContexts().foreach(threadContext => {
    println("\n\nThread: " + threadContext.thread.getName)
    println("Context: " + threadContext.currentContext)
    println("Last Update: " + threadContext.lastUpdateStackTrace)
  })
And depending on what I'm testing, I might wrap that in a scheduler to print it out every few seconds or once after I'm done with a test.
Here is an example output from a toy app:
Thread: main
Context: Context{Entries{span=Span.Empty},Tags{tags=dirty-thread}}
Last Update: java.lang.Thread.getStackTrace(Thread.java:1559)
kamon.context.Storage$Debug.kamon$context$Storage$Debug$$stackTraceString(Storage.scala:143)
kamon.context.Storage$Debug.store(Storage.scala:129)
kamon.ContextStorage.storeContext(ContextStorage.scala:58)
kamon.ContextStorage.storeContext$(ContextStorage.scala:57)
kamon.Kamon$.storeContext(Kamon.scala:19)
kamon.sample.DebuggingContext$.delayedEndpoint$kamon$sample$DebuggingContext$1(DebuggingContext.scala:21)
kamon.sample.DebuggingContext$delayedInit$body.apply(DebuggingContext.scala:9)
scala.Function0.apply$mcV$sp(Function0.scala:39)
scala.Function0.apply$mcV$sp$(Function0.scala:39)
scala.runtime.AbstractFunction0.apply$mcV$sp(AbstractFunction0.scala:17)
scala.App.$anonfun$main$1(App.scala:73)
scala.App.$anonfun$main$1$adapted(App.scala:73)
scala.collection.IterableOnceOps.foreach(IterableOnce.scala:553)
scala.collection.IterableOnceOps.foreach$(IterableOnce.scala:551)
scala.collection.AbstractIterable.foreach(Iterable.scala:921)
scala.App.main(App.scala:73)
scala.App.main$(App.scala:71)
kamon.sample.DebuggingContext$.main(DebuggingContext.scala:9)
kamon.sample.DebuggingContext.main(DebuggingContext.scala)


Thread: scala-execution-context-global-20
Context: Context{Entries{span=Span.Empty},Tags{}}
Last Update: java.lang.Thread.getStackTrace(Thread.java:1559)
kamon.context.Storage$Debug.kamon$context$Storage$Debug$$stackTraceString(Storage.scala:143)
kamon.context.Storage$Debug$$anon$4.close(Storage.scala:137)
kamon.instrumentation.futures.scala.CallbackRunnableRunInstrumentation$.exit(FutureChainingInstrumentation.scala:86)
scala.concurrent.impl.Promise$Transformation.run(Promise.scala:469)
scala.concurrent.BatchingExecutor$AbstractBatch.runN(BatchingExecutor.scala:134)
scala.concurrent.BatchingExecutor$AsyncBatch.apply(BatchingExecutor.scala:163)
scala.concurrent.BatchingExecutor$AsyncBatch.apply(BatchingExecutor.scala:146)
scala.concurrent.BlockContext$.usingBlockContext(BlockContext.scala:107)
scala.concurrent.BatchingExecutor$AsyncBatch.run(BatchingExecutor.scala:154)
java.util.concurrent.ForkJoinTask$RunnableExecuteAction.exec(ForkJoinTask.java:1402)
java.util.concurrent.ForkJoinTask.doExec(ForkJoinTask.java:289)
java.util.concurrent.ForkJoinPool$WorkQueue.runTask(ForkJoinPool.java:1056)
java.util.concurrent.ForkJoinPool.runWorker(ForkJoinPool.java:1692)
java.util.concurrent.ForkJoinWorkerThread.run(ForkJoinWorkerThread.java:157)
Notice how the main thread still has a context (I explicitly left it there), but the scala-execution-context-global-20 thread is empty. If I ignore the first 5-6 lines of each stacktrace (they are internal Kamon stuff) I can see that the place where I stored the last context on the main thread was DebuggingContext.scala:21 and indeed, that's where I left a dirty thread by storing a context, but not closing the returned scope.
Once you know where the threads are left dirty, we can figure out what to do. Let me know if you need any help with that!
Thanks for the explanation. I think I see what you mean here but I do not think we are doing any custom context changes. All the instrumentation should be kamon on our play application. Do you think it can be related?
Even if all the instrumentation is Kamon-only, there could be some edge cases that we are not covering properly. I would really recommend you to try reproducing the issue with the debug context enabled and see what the stacktraces say about it.
Ok. Then one last thing, how can I then connect a span I found on Jaeger with the stacktraces? Since I cannot always replicate this and it is now happening in our dev environment.
Facing the same issue. Jaeger is collecting multiple spans under the same trace id. I'm using version 2.1.8 and akka-http 10.2.2. We don't have any customization in the code.
Hi, does anyone know how to solve this ? Like a workaround ? The problem I have is, I have request A with trace ID 1, and then request B with trace ID 2, and 2 has only few spans showing. remaining spans of 2 are seen on trace ID 1
and @ivantopo this problem happens if we do a Kamon.storeContext(.....) and would not be a problem if we do
`Kamon.runWithContext(...) instead ?
Ok I managed to fix it by replacing
Kamon.storeContext(...) by Kamon.runWithContext(...) Thanks for your help