How to Add Data Layers on Custom Projections
https://github.com/jupyter-widgets/ipyleaflet/pull/598 added the ability to display maps with custom projections, which is highly useful for the polar regions!
It's a bit unclear currently what is supported for adding data layers onto maps with custom projections. According to the Proj4Leaflet readme it seems straightforward to support GeoJSON and Image Overlays, but as far as I can tell this isn't yet supported (ipyleaflet 0.13.0).
Here is a full gist (https://gist.github.com/scottyhq/39b39917e851a2fc691fa6e6d9716794) with a few self-contained examples for adding a coastline layer or simple bounding box for the south pole (projections.EPSG3031)
Default projection

SPS projection
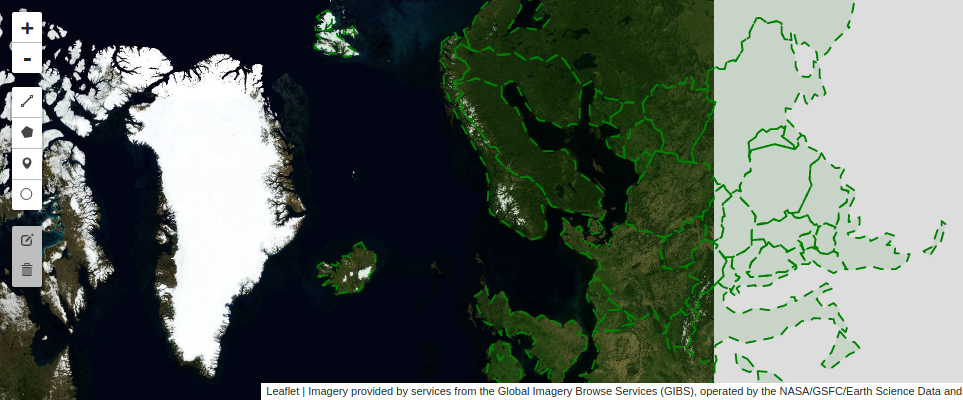
 And for the north polar projection (projections.EPSG3413) here is an example from @betolink with screenshot showing offset polygons
from ipyleaflet import Map, GeoJSON, projections
import json
import os
import requests

if not os.path.exists('europe_110.geo.json'):
    url = 'https://github.com/jupyter-widgets/ipyleaflet/raw/master/examples/europe_110.geo.json'
    r = requests.get(url)
    with open('europe_110.geo.json', 'w') as f:
        f.write(r.content.decode("utf-8"))

with open('europe_110.geo.json', 'r') as f:
    data = json.load(f)

m = Map(center=(60, 0), zoom=2,  crs=projections.EPSG3413)
geo_json = GeoJSON(data=data, style = {'color': 'green', 'opacity':1, 'weight':1.9, 'dashArray':'9', 'fillOpacity':0.1})
m.add_layer(geo_json)

m

cc @davidbrochart @asteiker
For the raster case, it is definitely on my todo list for https://github.com/davidbrochart/xarray_leaflet, but this project is still very young.
@scottyhq I did some debugging and the default polar projections I added are scaled and missing a resolution(16384.0,) to match the native blue marble zoom levels.
For now you could redefine 3413 and 3031, i.e. for the polar north:
fixed_north = {
    'name': 'EPSG:3413',
    'custom': True,
    'proj4def': '+proj=stere +lat_0=90 +lat_ts=70 +lon_0=-45 +k=1 +x_0=0 +y_0=0 +datum=WGS84 +units=m +no_defs',
    'origin': [-4194304, 4194304],
    'bounds': [
        [-4194304, -4194304],
        [4194304, 4194304]
    ],
    'resolutions': [
        16384.0,
        8192.0,
        4096.0,
        2048.0,
        1024.0,
        512.0,
        256.0
    ]
}
and then pass this to the map constructor.
m = Map(center=(90, 0),
        zoom=1,
        max_zoom=5,
        min_zoom=1,
        basemap=basemaps.NASAGIBS.BlueMarble3413,
        crs=fixed_north)
and the same for the southern hemisphere... I should fix the default polar projection definitions but in the meantime test this and let me know if works for your use case.
Now for ImageOverlays, I'll take a look as soon as I have some free time. Cheers!
@scottyhq I did some debugging and the default polar projections I added are scaled and missing a resolution(16384.0,) to match the native blue marble zoom levels.
Should we fix it in ipyleaflet?
yeah... I can submit a PR tonight, should be pretty straight-forward. I can add an example of how to use GeoJSON with these new projections while I'm at it.
Thanks so much for looking into this and providing a workaround @betolink !