awesome-notebooks
 awesome-notebooks copied to clipboard
Published
20 hours ago •
 jupyter-naas
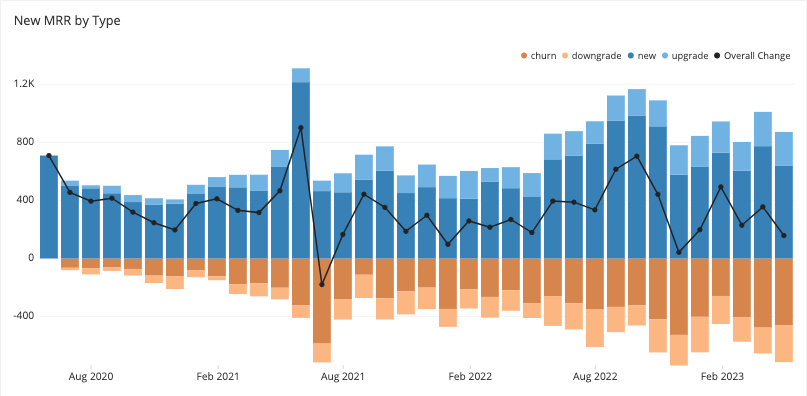
Notion - Create chart to follow MMR from database
Notion - Create chart to follow MMR from database
Destination: Notion, Plotly Domain: 📈 Sales From: Interviews, Research Github Issue Url: https://github.com/jupyter-naas/awesome-notebooks/issues/663 Last edited: April 14, 2022 5:16 PM Roles: Business owners, Executive, Sales Person Source: Stripe Type: Analytics
Input
Data model :
- ENTITY : “Company A”
- SCENARIO : “Actual” (“Actual + Forecast” v1)
- DATE : format, %b %Y, frequency = month
- CHART: “line”, “bar”
- GROUP : “churn”, “downgrade”, “new”, “upgrade”, “overall change” (line only)
- VALUE: Value in K$
Connect to database
from naas_drivers import notion

notion_token = "secret_ALstzXsSXoF9zbcUakMYE1OufXHVO---------"
notion_database = "https://naas-official.notion.site/7be2eadafecb4b829a054d14c39fc9a0?v=20560c4a12754865857d0818a2b992db"

# Get database object
db_notion = notion.connect(notion_token).database.get(notion_database)

# Get database as dataframe
df_notion = db_notion.df()
df_notion
Model
Create barline chart
Update layout :
- backgroud = white
Output
Export chart in html, share assets
Hi @poojashri @FlorentLvr I'm putting this card in Backlog and changing name and content for better clarity.
Hi @poojashri @FlorentLvr I'm putting this card in Backlog and changing name and content for better clarity.
@poojashri should we proceed without you on this one?