angular-chart.js
 angular-chart.js copied to clipboard
Problem using time series for IE 11
I am new to using angular-chart but have come up against an issue when trying to use the "time" scale in IE 11.
E.g. scales: { xAxes: [{ type: "time", display: true, scaleLabel: { display: true, labelString: 'Date' } }
I initially thought it was something to do with the chart I had created but the problem is also evident in the examples that come with angular-chart e.g. line-point-data.html, line.html & combo.html.
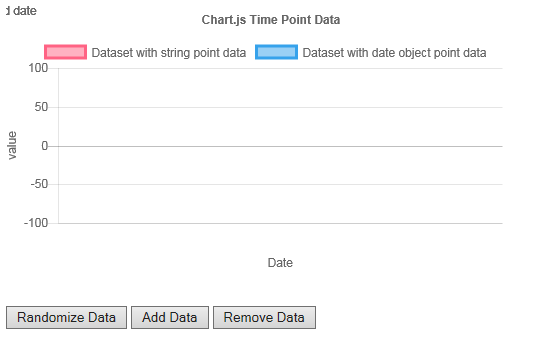
The examples work as expected when using Chrome:

However, using IE the Y-Axis is drawn correctly but neither the line nor the X-Axis is displayed as expected.
I am using version: 1.1.1 of angular-chart and Internet Export 11 Version 11.0.9600.18738. The other examples all appear to work correctly other than those that use the "time" scaling option.
I have the same issue with version 1.1.1 of angular-chart and Internet Explorer 11 Version 11.1007.10586.0.
Display with Chrome :

Display with IE 11 :
