www.jsdelivr.com
 www.jsdelivr.com copied to clipboard
Redesign
Your Render PR Server URL is https://www-jsdelivr-com-pr-400.onrender.com.
Follow its progress at https://dashboard.render.com/web/srv-c3omq3s6fj33so8vcgr0.
Note here about wording. We are mixing up "GB" and "bandwidth" in the design. In all places where we refer to "requests" and "GB", it should be "requests" and "bandwidth" and the unit should be part of the value. E.g. this switch but it's in many places so use search for "GB" and fix everywhere:

History page:
Done:
- [x] some icons are blurred, please try to find svg version for all logs, where not available, make sure to use the correct 1x and 2x sizes for png - e.g., the rawgit icon has just one size and it's also wrong,
- [x] update the content based on this comment: https://github.com/jsdelivr/www.jsdelivr.com/issues/408#issuecomment-916949064
Purge page:
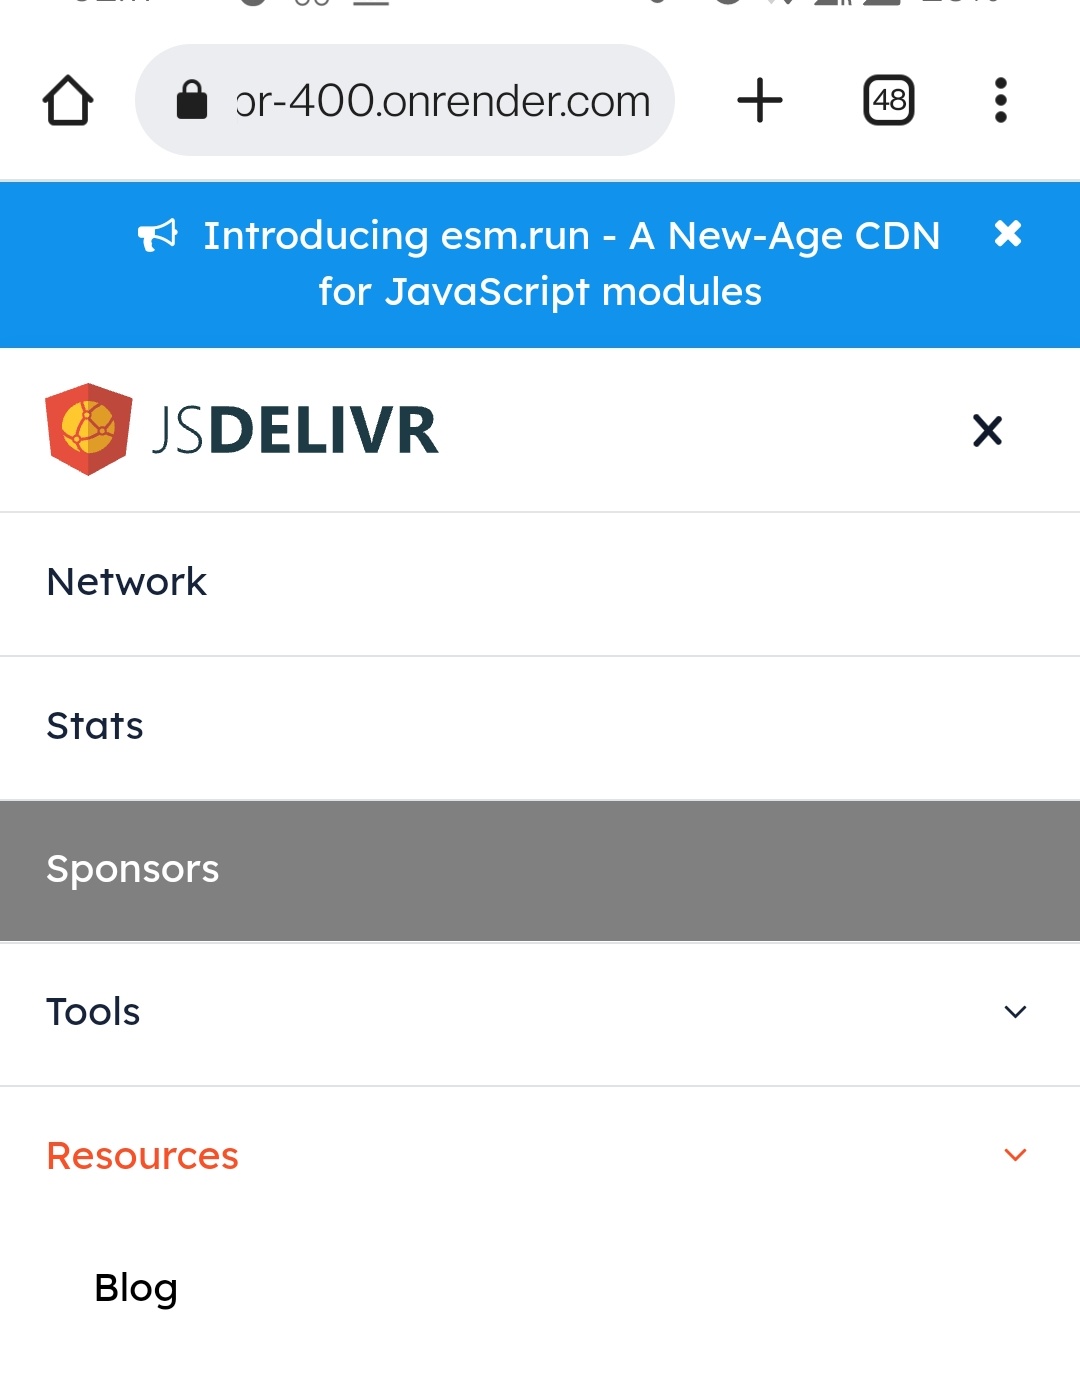
- [ ] the API accepts paths, not full URLs, you need to parse the path from the input and send only that
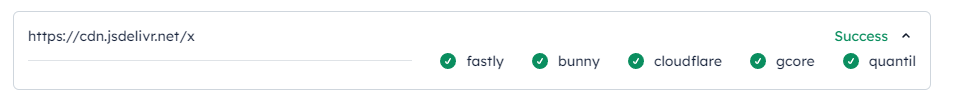
Regarding urls in purge page, I need more details. For example, is it acceptable that I write the below url into input box?
https://cdn.jsdelivr.net/abc
And here, what can be the exact path to send the request to api? Is it filtered path like this?
https://cdn.jsdelivr.net/
I want to confirm if this is correct or not.
@MartinKolarik
@IvanAdamovic646 user types https://cdn.jsdelivr.net/abc you send /abc, user types http://cdn.jsdelivr.net/def you send /def
any other domain/protocol => error
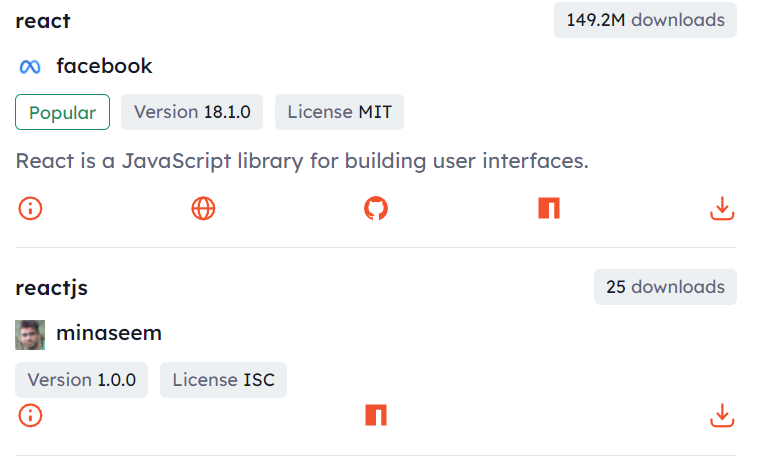
Package page: https://www-jsdelivr-com-pr-400.onrender.com/package/npm/react
- [x]
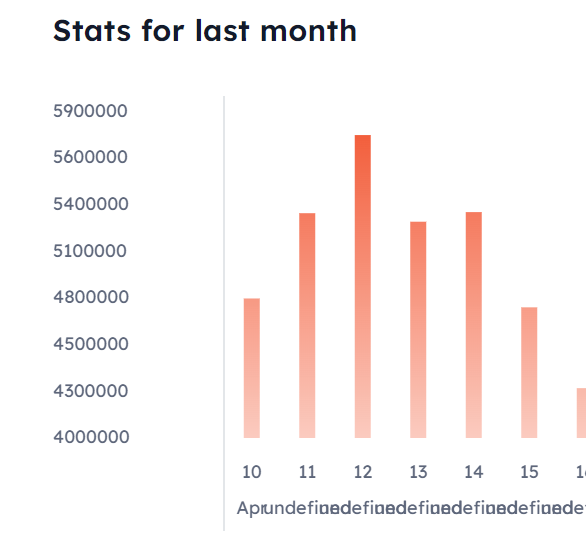
undefinedchart labels on Statistics tab - be sure to test all period options including yearly
- [x] if a package doesn't have a readme, show the "Show/Configure Files" tab on load (https://www-jsdelivr-com-pr-400.onrender.com/package/npm/yandex-metrica-watch)
- [ ] chart labels on Y axis - number should be aligned to the right and have space between every three digits (see design), use
_.formatNumber - [ ] "Group by" - this needs to be implemented on the client. Show only the groups for which we have all the data, drop the first/last group with partial data. Example: today is May 13, I select yearly range and group by month. Data for May won't be shown because the month isn't complete yet, the chart will have (from right to left) April, March, ..., until June 2021 (again May 2021 won't be shown because the API response will only have data for dates 13. 05. 2021 - 31. 05. 2021).
- [x] Ignore "day" period for charts - if a user selects "day", don't update the charts, keep whatever was shown before, update only the tables (see how it works at https://www.jsdelivr.com/package/npm/react)
- [x] Vulnerabilities badge needs to be a link (see at master branch)
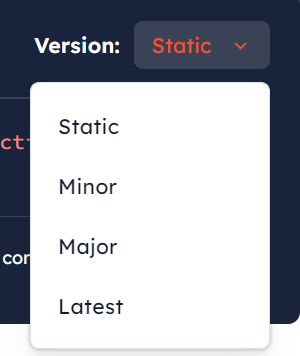
- [ ] the version text should not change color on open - still wrong when you open it and hover something in the dropdown
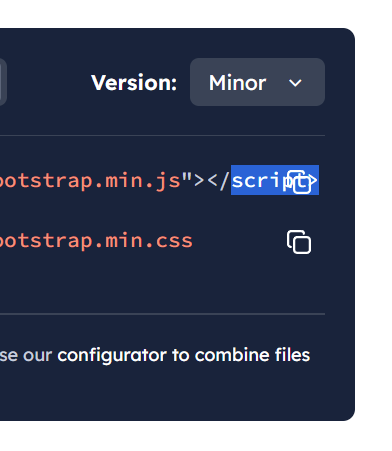
- [x] code/icon overlap
Footer:
- [x] looks broken on 800px width, we should either try to fit the desktop version to that size or show the mobile version up to 992
- [x] newsletter form does nothing. Open https://jsdelivr.us11.list-manage.com/subscribe?u=0c85fe2c9a60310df9a3d6751&id=283887f736 in a new tab and pre-fill the field with what the user wrote in footer
Repost of my previous comments because GitHub now hides them
Purge page:
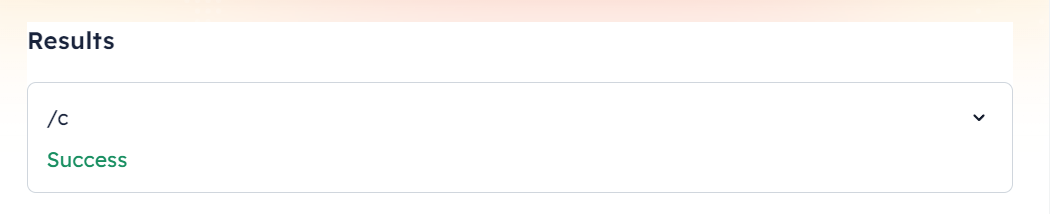
- [x] on mobile version (width 600), the results box looks broken:
done:
- [x] only allow URLs on
https://cdn.jsdelivr.netdomain (accept http too) - [x] the API accepts paths, not full URLs, you need to parse the path from the input and send only that
- [x] the expanded view doesn't match design
- [x] not sure why the whole row is clickable and changes border color on click but expands only when clicked on the "success" text:

probably expand on click anywhere and don't change border, make sure the cursor indicates the area is clickable
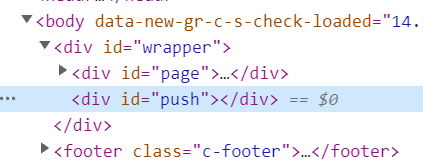
- [x] the footer must stick to the bottom of the screen (this applies to all pages where the content is too short)
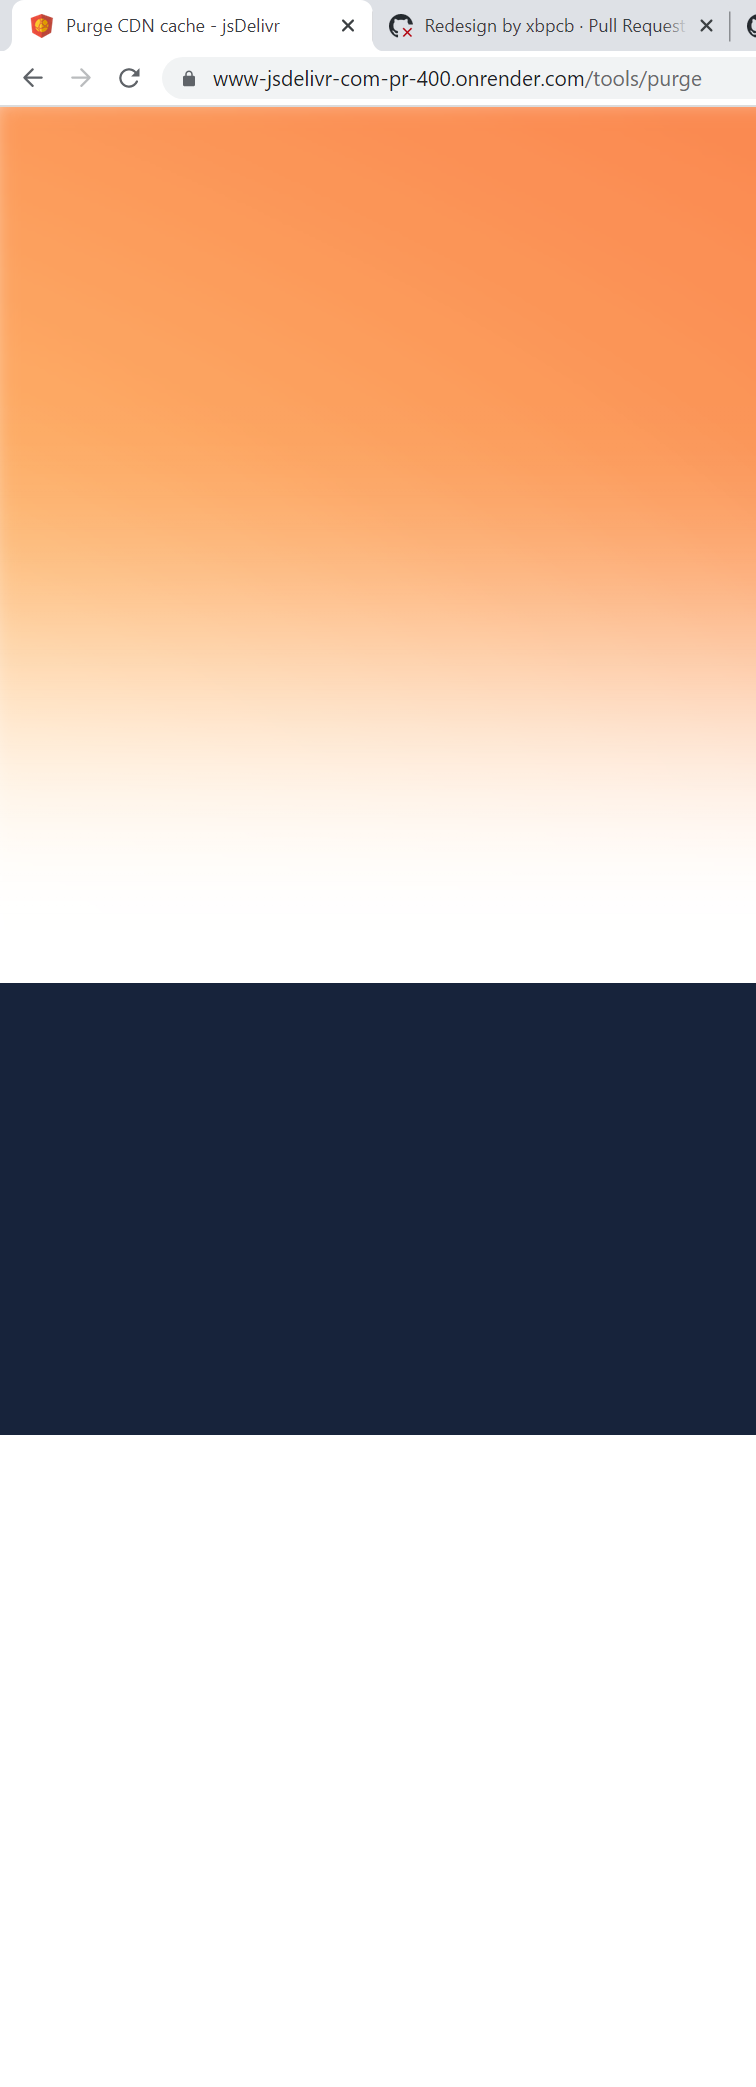
see https://www.jsdelivr.com/tools/purge, in CSS it was previously implemented by the wrapper/push elements
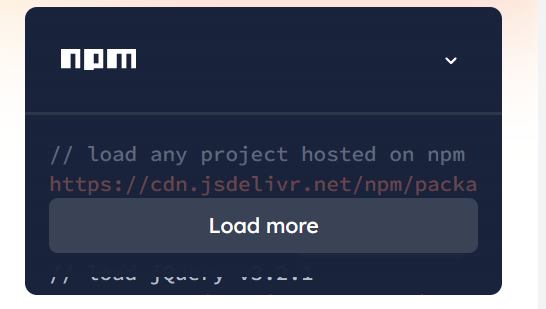
Homepage:
- [x] the buttons should be aligned by type (i.e. npm always in forth column)
- [x] no "load more" here, always show the full version (this was updated in the design too)
Done:
-
[x] keywords https://www-jsdelivr-com-pr-400.onrender.com/?query=bootstrap-vue - show full text, not "..." but only first 15 keywords, allow it to be multiline, make sure it doesn't overflow (see https://www.jsdelivr.com/?query=bootstrap-vue)
-
[x] package description in search results should be full-width (12 columns, not 8)
-
[x] on load, if there is a search query, and on pagination change, it must scroll to the top of the search results like here, not top of the page
Please also check this on all pages: https://github.com/jsdelivr/www.jsdelivr.com/pull/400#issuecomment-1094100977
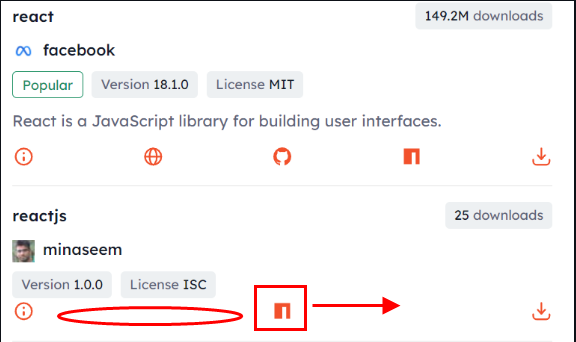
Total button count is 5 , isn't it? So you mean npm button should always be in fourth column . Is it ok to have a gap between first button and npm button? #
@itstarlight0808 yes, fixed position for each button type, empty space when it's missing.
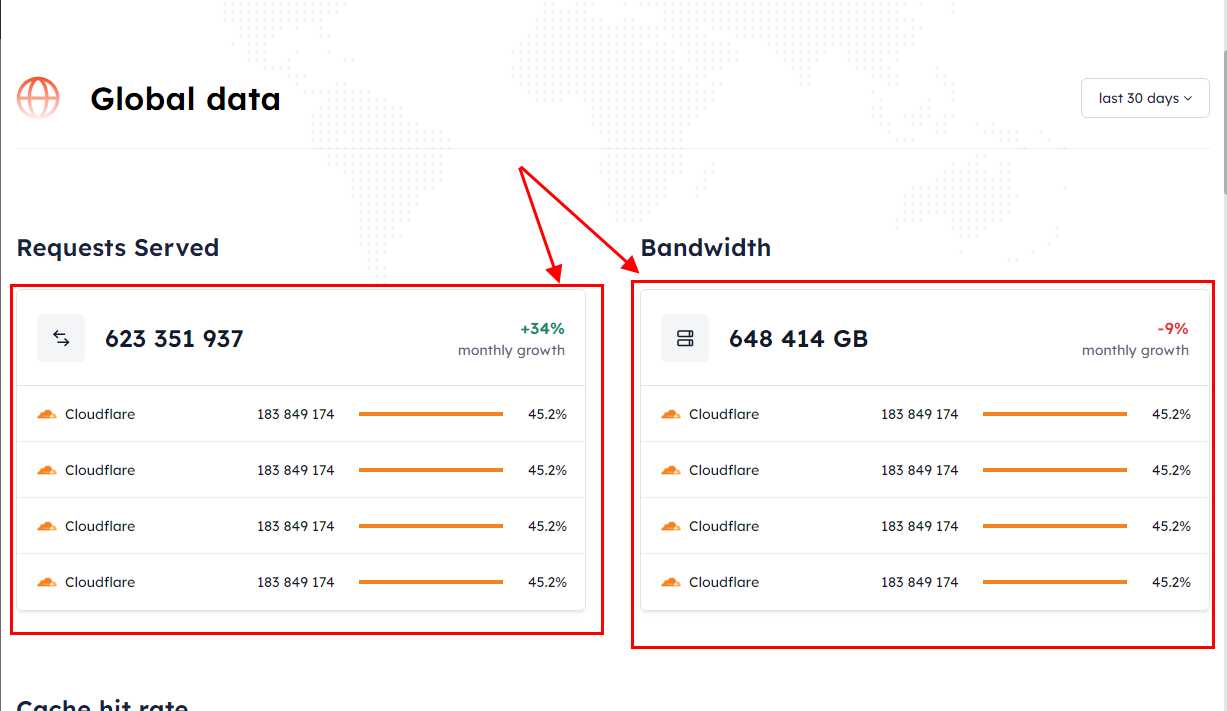
@MartinKolarik How are you? On stats page, how to get necessary data using API.
- Global data 1.1 Requests Served - how to get it? 1.2 Bandwidth - how to get it? Let me know full detailed api url and example. Thanks.
I already got it , but can't notice its usage. Full API url is like this? https://data.jsdelivr.com/v1/stats/network/providers?type=hits&period=month
But it doesn't work. :(
 How to get
 Requests served and Bandwidth data using API?
Please give me a hint.
Thanks.
@itstarlight0808 that's exactly how the URL will be but it isn't live yet, that's why you have sample data files there. You can create all functions as needed (including the URL construction logic) but instead of making real http calls just return data from that zip (copy paste the data into the JS as needed and when the API is live we'll just remove it and make real http calls).
So for those two tables, render data from API-data-2.1-network-providers.json for now. Note that the ZIP I uploaded here is an updated version - newer than what you got before.
I'll be posting the rest of the issues in #438 - in some cases the fixes were not correct or broke something so be sure to recheck everything that isn't marked as done there.
Hello. @MartinKolarik How are you? I have questions regarding 2.1 requests served over time chart. Currently, it's using hitsData: { rank: 3, typeRank: 2, total: 6222085912, versions: { '0.0.1': { total: 18, dates: { '2022-03-26': 0, '2022-03-27': 0, '2022-03-28': 0, '2022-03-29': 9, ... Instead of this, should I have to use API-data-2.1-network-providers.json data to draw chart? Thanks.
@itstarlight0808 yes the data right now is completely wrong, replace it with the file I sent.
@MartinKolarik 2.1 Requests served over time /stats/network/providers?type={ hits | bandwidth }&country=CA&period=month 2.2 Requests served by country /stats/network/countries?type={ hits | bandwidth}&period=month
I need to confirm these request url. Did I properly write these request urls?