jsgantt-improved
 jsgantt-improved copied to clipboard
Bug when not on 100% zoom
If the browser is viewing the page at anything other than 100% zoom then bars may not be sized or positioned correctly.
Even with 100% zoom i am experiencing this issue. Tasks gets offset by weeks in large duration projects
https://user-images.githubusercontent.com/15646324/28788779-d048ded6-763b-11e7-9e4d-04643777bcc0.png
This seems to be the same issue as #36 and #43 which are being fixed in the pull request #41. I'll also close it, leaving #36 open and avoiding multiplicity.
PR #41 fixes partially this issue, but I will keep it open for future reference.
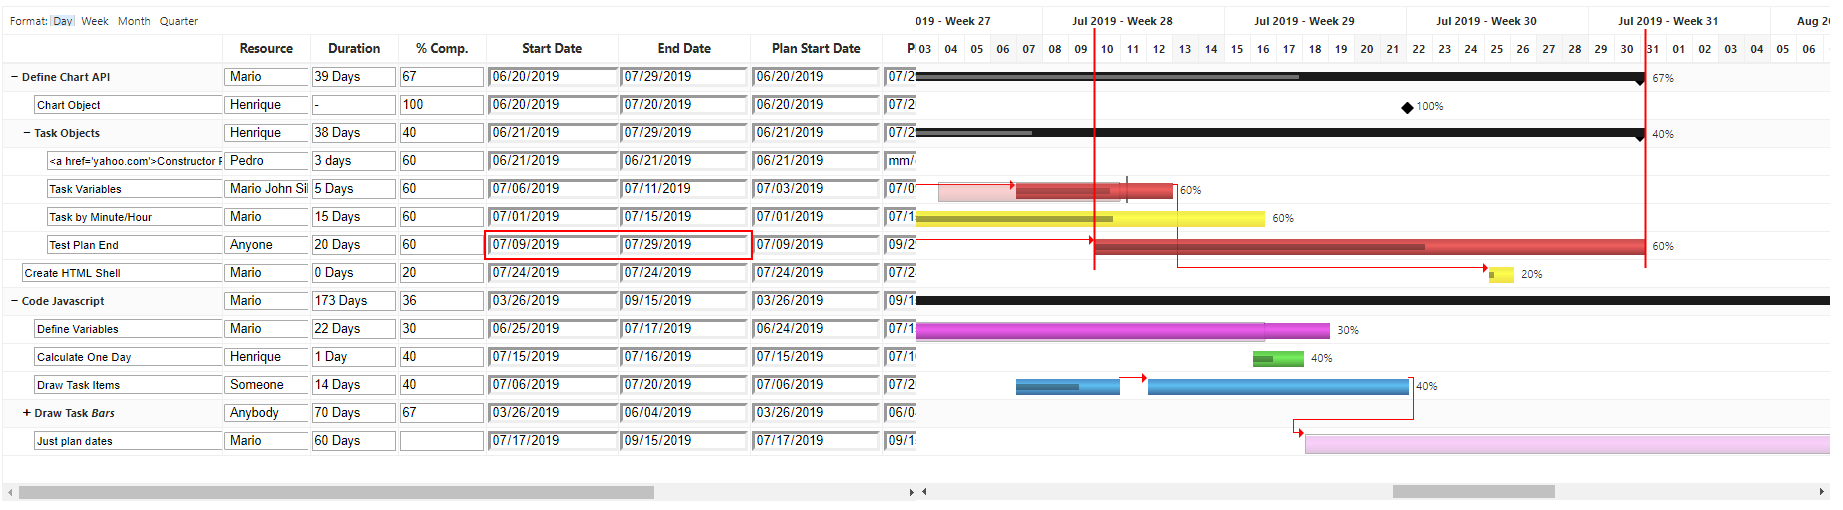
I have issues with zooming in current version as well. For example here's the demo page with 125% zoom in Chrome:
After some poking (testing with "day" format) it seems that header td width varies when zooming. For example at 100% it's 21, but at 125% it's 20.8. I tried to set DAY_CELL_MARGIN_WIDTH to 2.8 and check with 125% zoom and it displays just fine. Thus <format>_CELL_MARGIN_WIDTH constants are actually variables, but it's not clear at the moment how to get it.
UPD: It's even worse - cells are of different width. With 125% zoom i have first 133 columns with width 20.8 and the rest is with 21.6.
UPD 2: Tried to replace header table with divs - they don't have such problem. If we go this way - we have to also replace cells for chart table with divs also. I've no idea about performance implications, but i don't think it may affect anything. It can be quite a breaking change. I hope it can be resolved without abandoning table.
thats true.. table may not be very good for this.. nowdays divs are best suit for design right?
but i guess that proper css (using % maybe) shuld work with tables.. no?
but thats a good idea to try out divs instead
Probably CSS will do, but I can't find anything on it, no related properties or methods. Probably i'm missing something.
The only way i can imagine solving it with tables at the moment is to do bar positioning based on cell absolute offsets after headers is added, which sounds like quite a mess.
@mariohmol shouldn't this one be reopened? It's easily reproducible at the moment on the demo page.
I'm working on this issue and converted chart to divs. With divs it works quite fine.
Here's current demo at 100%. I'm not sure why but task end dates look a bit misplaced to the right.
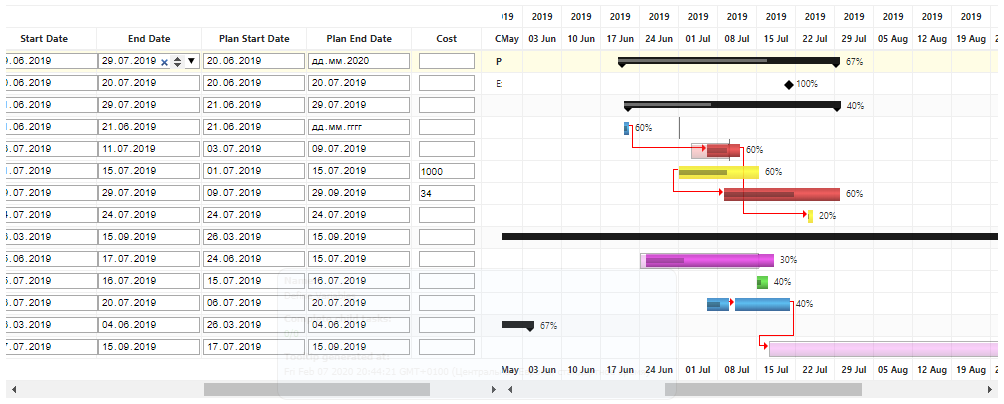
Here's it at 80%:
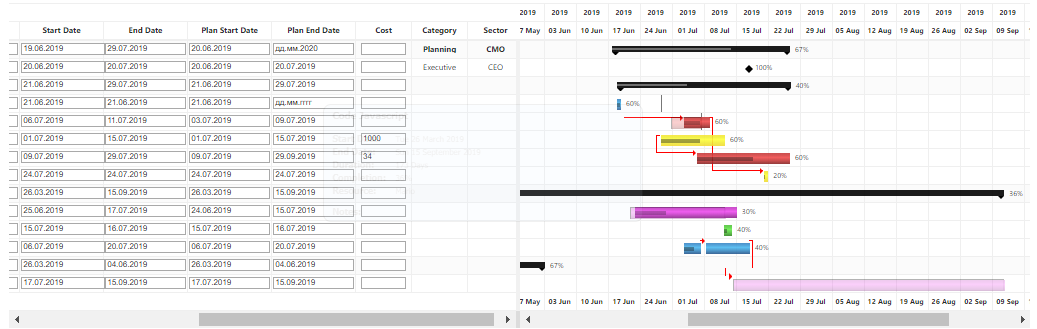
Here's div version at 100%:
And at 80%:
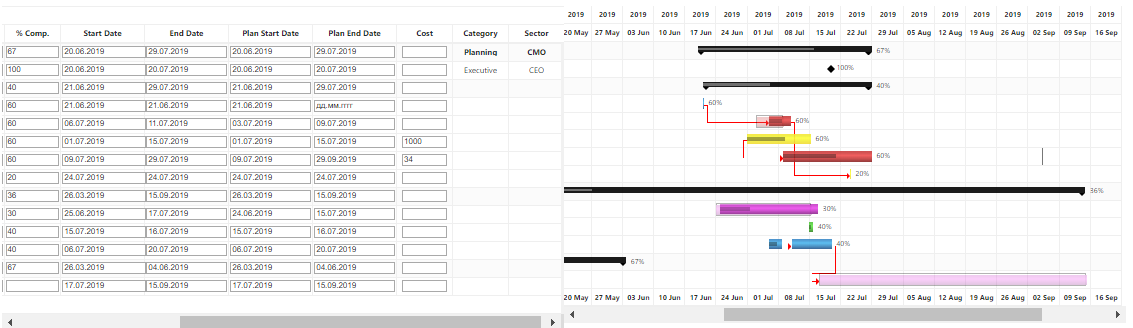
So the bars are properly placed now, but
- Some borders disappear
- Chart doesn't match list anymore. Might be table scaling issues again, so looks like if i convert chart to divs - task list must be converted too
What i don't like about it is that this is a breaking change in a lot of use cases.
I'm still looking into other options.
Source is here https://github.com/nidu/jsgantt-improved/tree/23-div-based-tables
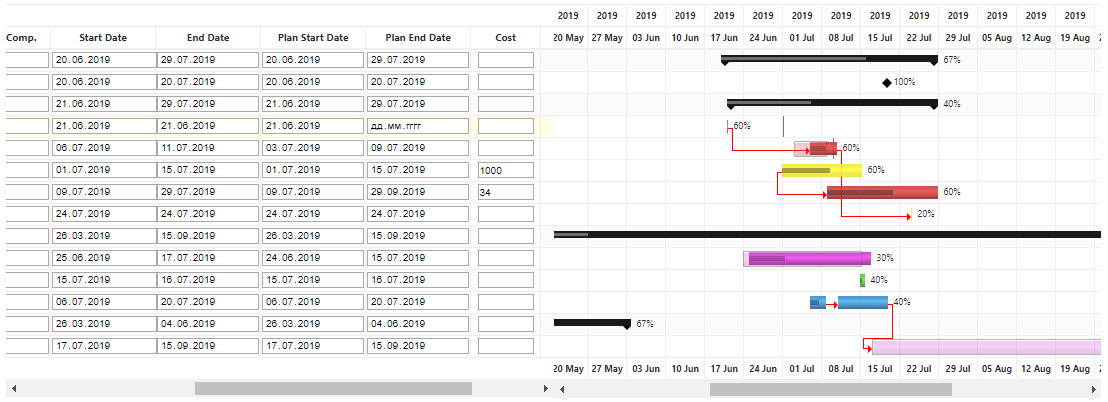
Ok it seems like there's a better solution.
If i just set table-layout:fixed for chart tables and set widths for td - the issues is fixed. For example here are again screenshots of current version (top) and new version (bottom) at 80% zoom:
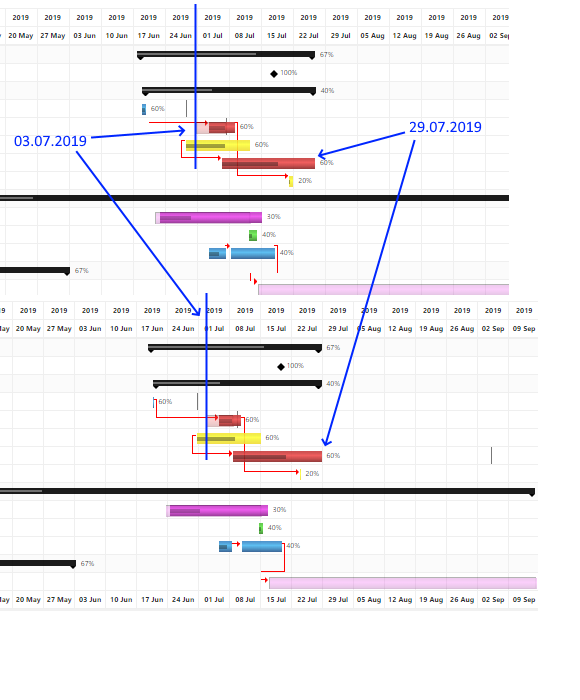
This change is much simpler and less breaking. As a bonus according to MDN fixed table layout is faster.
Here's the change.
@mariohmol do you think we can go with this approach? I don't see any issues with it so far
this looks good.. as we keep the same HTML structure and change basically CSS..
if this works good when u test.. put in a PR and lets use this =)