josephmure
josephmure
Thanks @jschueller, that works. I only had to change the last line of the script to ``` viewer.View(graph, legend_kw={'bbox_to_anchor':(1,1), 'loc':"upper left"}) ``` to produce 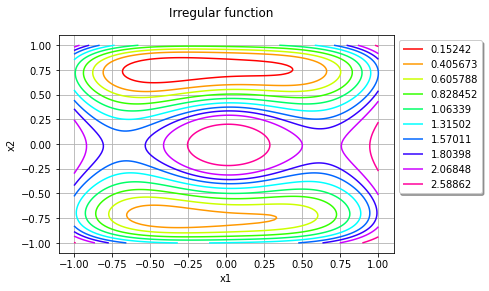 Perhaps this should be the...
Follow-up question: how do you set legend kwargs when your graph is inside a `GridLayout`?
If it is a choice between the matplotlib convention and the R convention, I would go with matplotib. After all, nobody expects a Python module to maintain R conventions.
Somewhat related question: how can you set the title of a subgraph within a `GridLayout`? I am trying to improve the graph at the top of the [Dirichlet doc page](https://openturns.github.io/openturns/1.16/user_manual/_generated/openturns.Dirichlet.html)...
Indeed, your PR fixes this issue. Thanks!
The [Kriging the cantilever beam](http://openturns.github.io/openturns/1.16/auto_meta_modeling/kriging_metamodel/plot_kriging_cantilever_beam.html) example is currently broken in the 1.16 doc because the data are not transformed. Is `IsoProbabilisticTransformation` really the answer to this? I think there are...
Yes the link works now! When was the doc updated? I could have sworn it was still broken when I wrote the comment O_o
> To do this, I used `docfast.py` with the following parameters: > > ```shell > $ git add . && cd build && make -j8 && make install && cd...
I am unable to reproduce this very old bug. Maybe it is solved? What do you think @jschueller ?
Should we close this issue?