hnn-core
 hnn-core copied to clipboard
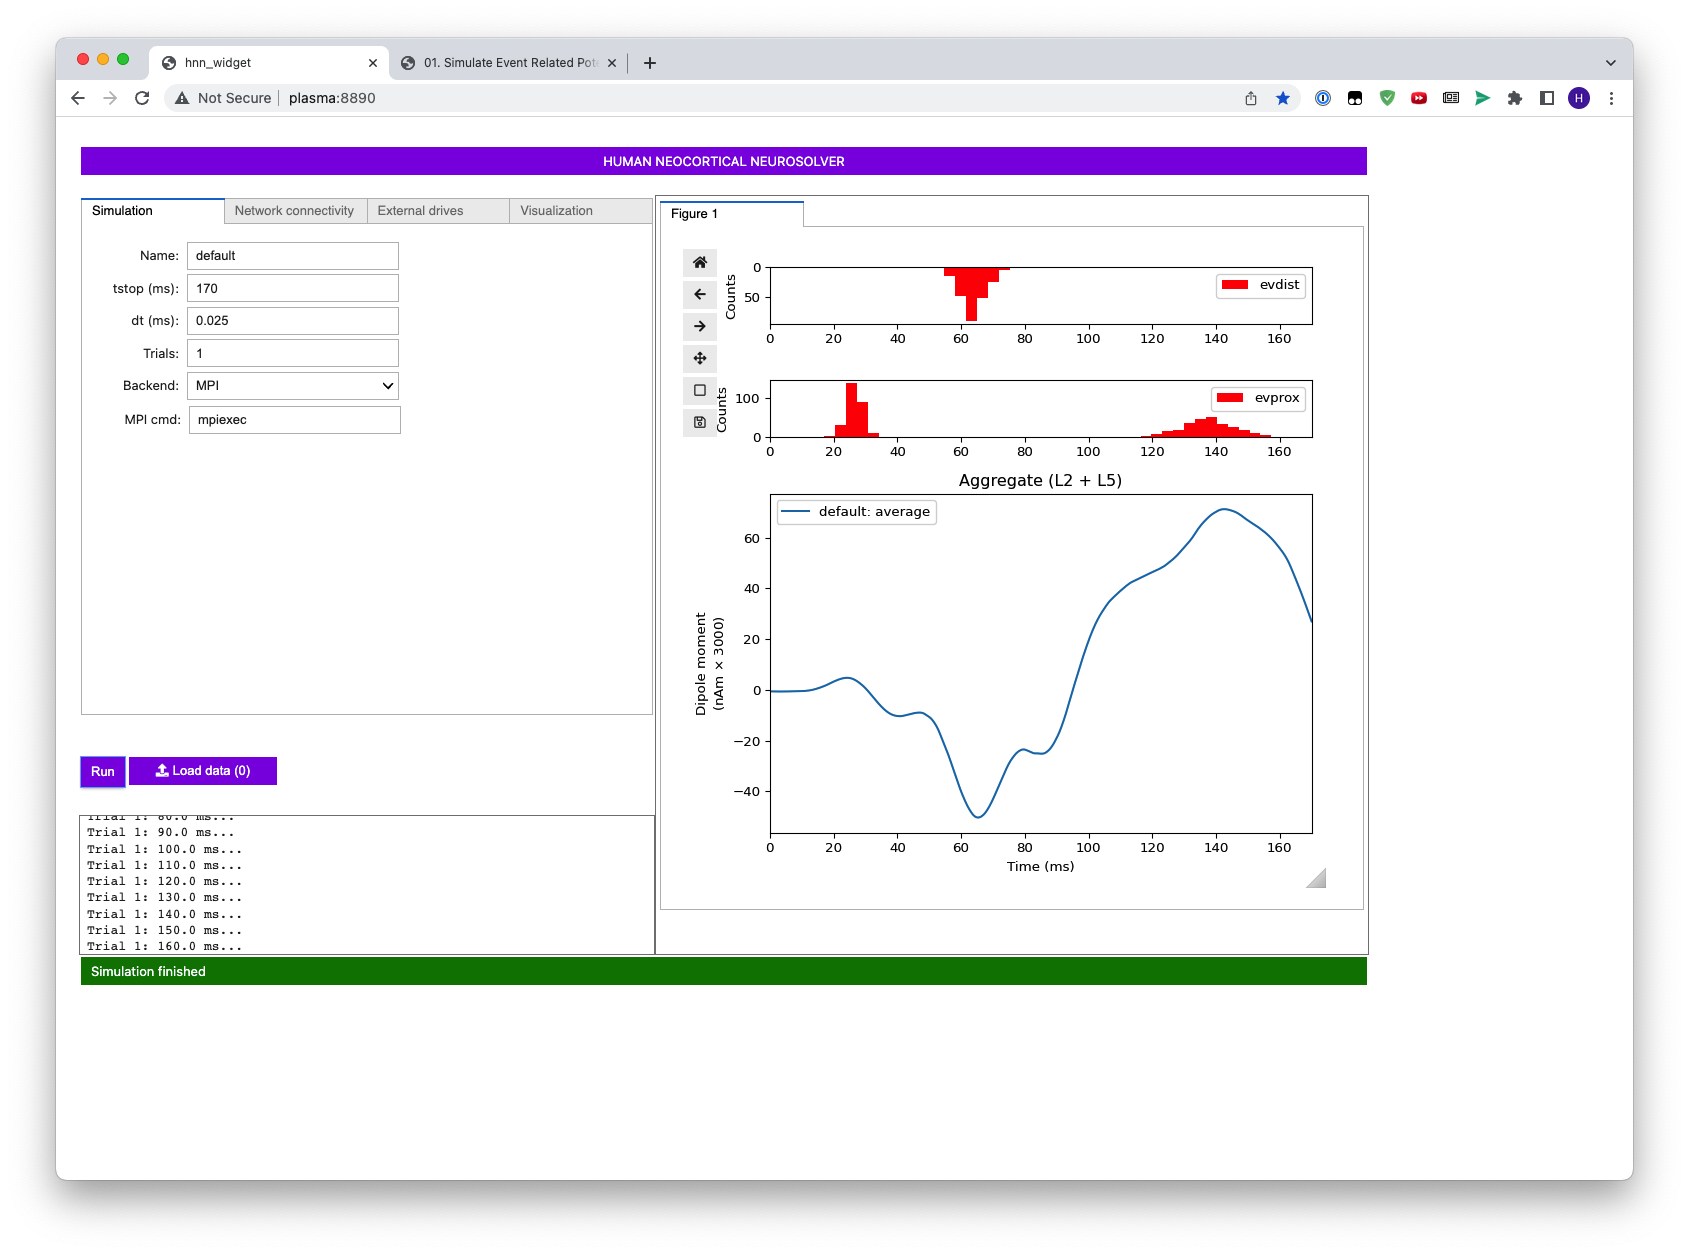
[MRG] Add layered histogram
Codecov Report
Merging #639 (595ebf2) into master (cdd4050) will increase coverage by
0.03%. The diff coverage is100.00%.
:exclamation: Current head 595ebf2 differs from pull request most recent head 7538490. Consider uploading reports for the commit 7538490 to get more accurate results
:mega: This organization is not using Codecov’s GitHub App Integration. We recommend you install it so Codecov can continue to function properly for your repositories. Learn more
@@            Coverage Diff             @@
##           master     #639      +/-   ##
==========================================
+ Coverage   92.19%   92.23%   +0.03%
==========================================
  Files          22       22
  Lines        4282     4289       +7
==========================================
+ Hits         3948     3956       +8
+ Misses        334      333       -1
| Impacted Files | Coverage Δ | |
|---|---|---|
| hnn_core/gui/_viz_manager.py | 91.39% <100.00%> (+1.56%) |
:arrow_up: |
| hnn_core/gui/gui.py | 94.87% <100.00%> (ø) |
... and 1 file with indirect coverage changes
Help us with your feedback. Take ten seconds to tell us how you rate us. Have a feature suggestion? Share it here.
Should the color for prox and dist be different?
I’d like to, but we don’t have access to it unless the original plot_spikes_hist is changed.
Should the color for prox and dist be different?
Personally, I don't think the colors need to be different because they're already labeled and are now oriented a different direction.
is the idea to have the 3 x 1 layout only the first plot after simulation? Subsequent plots will plot the proximal and distal together? Or would it make sense to add extra plot types : input histogram (distal) and input histogram (proximal) ?
is the idea to have the 3 x 1 layout only the first plot after simulation? Subsequent plots will plot the proximal and distal together? Or would it make sense to add extra plot types : input histogram (distal) and input histogram (proximal) ?
That’s the default option. For other manually added figures, users can still select the 1:1:6 layout and add those histograms themselves. I don’t think we need to provide a “packed” solution for histograms in the plot type section, as it requires manipulation across multiple axes. The manipulation of axes (using the layout dropdown menu) and plots (using the plot type dropdown menu) are currently orthogonal. However, if we really want it, we could achieve it by dynamically disabling some plot types for certain layouts and add an extra layer of simulating two sequential plotting operations.