Matplotlib warning in plot_spikes_hist with multiple trials
With the following code:
#...
hnn_core_root = op.join(op.dirname(hnn_core.__file__))
params_fname = op.join(hnn_core_root, 'param', 'default.json')
params = read_params(params_fname)

# net = jones_2009_model()
net = Network(params, add_drives_from_params=True)

with MPIBackend():
    dpls = simulate_dipole(net, tstop=170., n_trials=3)

window_len, scaling_factor = 30, 3000
for dpl in dpls:
    dpl.smooth(window_len).scale(scaling_factor)

fig, axes = plt.subplots(2,
                         1,
                         sharex=True,
                         figsize=(6, 6),
                         constrained_layout=True)
plot_dipole(dpls, ax=axes[0], layer='agg', average=True)
net.cell_response.plot_spikes_hist(ax=axes[1])
#...
we got some warnings
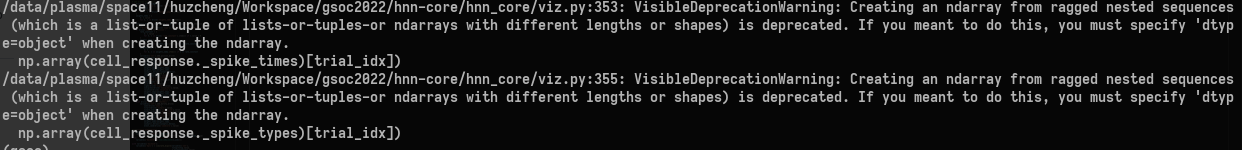
We also got similar warnings for spike plots
Thanks for reporting this. Would you mind editing the code above so I can copy paste to reproduce? Let me know when this is done.
import os.path as op

import hnn_core
import matplotlib.pyplot as plt
from hnn_core import (JoblibBackend, MPIBackend, jones_2009_model,
                      simulate_dipole, read_params, Network)
from hnn_core.viz import plot_dipole

hnn_core_root = op.join(op.dirname(hnn_core.__file__))
params_fname = op.join(hnn_core_root, 'param', 'default.json')
params = read_params(params_fname)

# net = jones_2009_model()
net = Network(params, add_drives_from_params=True)

# with JoblibBackend(n_jobs=2):
with MPIBackend():
    dpls = simulate_dipole(net, tstop=170., n_trials=3)

window_len, scaling_factor = 30, 3000
for dpl in dpls:
    dpl.smooth(window_len).scale(scaling_factor)

fig, axes = plt.subplots(2,
                         1,
                         sharex=True,
                         figsize=(6, 6),
                         constrained_layout=True)
plot_dipole(dpls, ax=axes[0], layer='agg', average=True)
net.cell_response.plot_spikes_hist(ax=axes[1])

plt.savefig("erp_sample.png")
generates
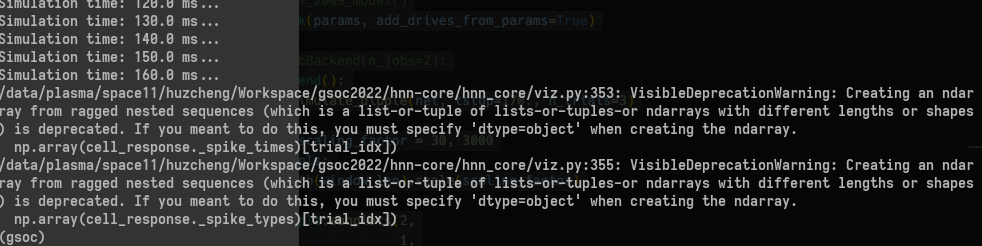
At first glance, I'm guessing this error occurs when certain cells spike while others don't?
I was able to reproduce this error. The problem is due to the code in this 'if' statement and can easily be solved by either setting the dtype argument when instantiating the np.array or by actually looping over the indices in trial_idx (which is actually a list of int here) and appending selected trials to a master array of spikes. The latter solution would be preferable as it'd be much easier to intuitively read.