chaiNNer
 chaiNNer copied to clipboard
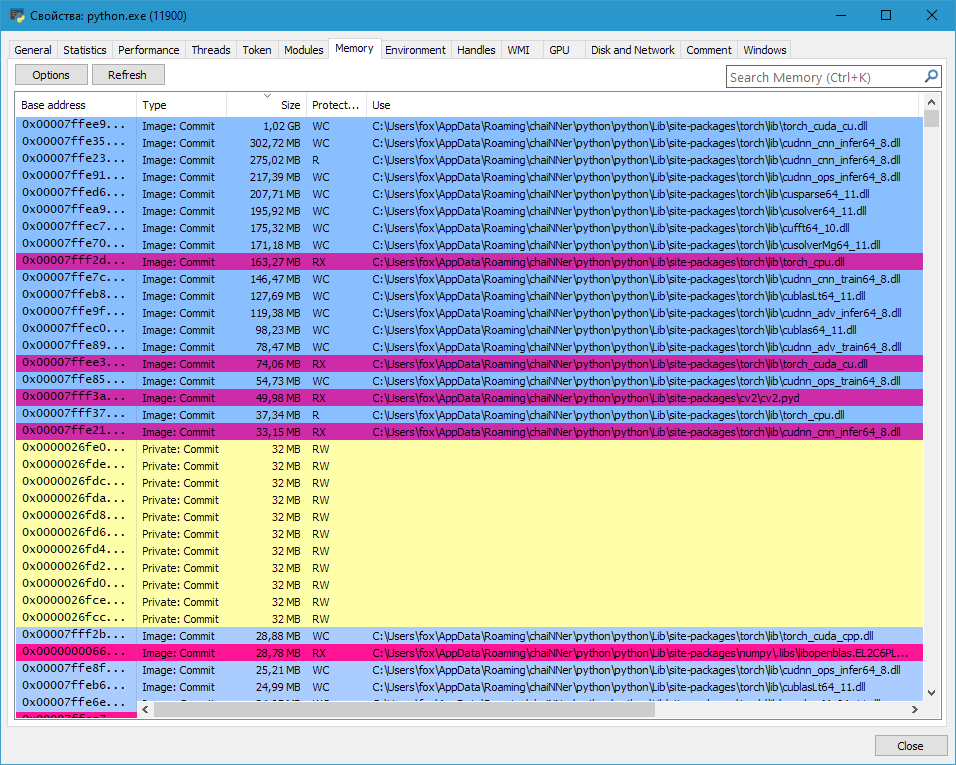
Memory leak python.exe
Information:
- Chainner version: 0.11.2
- OS: Windows 10 Pro
Description
I just created the nodes and ran the canvas. And so for some time.

Stats
Priority, 8
Cycles, 152 160 458 329
Cycles delta, 3 625 704
Kernel time, 0:00:00:14:328
Kernel delta, 0
User time, 0:00:00:22:546
User delta, 0
Total time, 0:00:00:36:875
Total delta, 0
Private bytes, 9,06 GB
Private bytes delta, 0
Peak private bytes, 9,16 GB
Virtual size, 46,41 GB
Peak virtual size, 46,52 GB
Page faults, 1 639 670
Page faults delta, 0
Hard faults, 15
Hard faults delta, 0
Working set, 3,22 GB
Peak working set, 3,4 GB
Private WS, 2,85 GB
Shareable WS, 376,38 MB
Shared WS, 10,02 MB
Shared commit, 7,43 MB
Private commit, 9,07 GB
Peak private commit, 9,25 GB
Page priority, Normal
Reads, 16 459
Reads delta, 0
Read bytes, 720,94 MB
Read bytes delta, 0
Writes, 238
Writes delta, 0
Write bytes, 46,79 kB
Write bytes delta, 0
Other, 25 696
Other delta, 0
Other bytes, 1,52 MB
Other bytes delta, 0
I/O priority, Normal
Handles, 429
Peak handles, 429
GDI handles, 0
USER handles, 9
Paged pool bytes, 8,55 MB
Peak paged pool bytes, 8,56 MB
Nonpaged pool bytes, 150,03 kB
Peak nonpaged pool bytes, 299,82 kB
Running time, 01:07:37.913
Suspended time, 00:00:00.000
Hang count, 0
Ghost count, 0
ContextSwitches, 2 714 655
NetworkTxRxBytes, 0
Dedicated memory, 2,56 GB
Shared memory, 56,81 MB
Commit memory, 2,62 GB
Total memory, 5,23 GB
Reads, 219
Read bytes, 131,77 MB
Read bytes delta, 0
Writes, 24
Write bytes, 96 kB
Write bytes delta, 0
Total, 243
Total bytes, 131,86 MB
Total bytes delta, 0
Receives, 143
Receive bytes, 36,37 kB
Receive bytes delta, 0
Sends, 271
Send bytes, 789,15 kB
Send bytes delta, 0
Total, 414
Total bytes, 825,52 kB
Total bytes delta, 0
Logs logs.zip
What's your chain? Did this spike in memory usage occur before, during, or after running the chain?
@RunDevelopment
What's your chain? Did this spike in memory usage occur before, during, or after running the chain?
On a blank canvas (just started chaiNNer) memory consumption 3.56GB (python.exe). Load the project resulted in the consumption of 4.84GB of RAM and 1.14GB of VRAM. After run 8.74GB RAM and 2.31GB VRAM. Further memory does not leak yet. But still, why would he consume so much in idle time? Cupscale didn't keep python running. By the way, if I forcibly terminate python.exe, chainner will not be able to restart it itself. Project: last2.zip
@joeyballentine yes. 3060ti 8GB.
The more models I use, the more memory consumption. As I understand it, because all models are launched simultaneously. Is it possible to make a mode so that they run in turn (sequentially) and the heavy calculations of the previous one are unloaded from memory?
I'm working on making it so we remove stuff from the cache that isn't needed anymore. that should significantly reduce memory consumption.
The issue is we cache every result from every node even when we don't need it anymore. This was originally both for memoization of the graph as we execute to avoid processing a node twice, but also for the pause/resume feature. But, we can smartly remove stuff we don't need. I've been working on this recently (even before you made this issue) but I just haven't had time to continue it
I think that the problem with 3.56GB is that when you start, heavy libraries are loaded into memory instead of loading them on demand and then unloading them as unnecessary.
Is it possible to make a mode so that they run in turn (sequentially) and the heavy calculations of the previous one are unloaded from memory?
What if we create a queue node? It has one input and many outputs (it would be nice if you could set as many as you like via input). The logic is simple, it executes each output branch in order (not all at once). It would be possible to unload intermediate data from already worked out branches.
Branching is not possible at the moment, but it's something we want to add eventually.
If rather fix the root cause of this, which is that chaiNNer for whatever reason is keeping stuff in RAM that it shouldn't.
Even with my caching fixes (including #860 which fixes my mistakes) chainner holds onto more ram than it should. We really need to figure out where this is happening and resolve it
Figured it out somewhat. The memory leak has to do with my pytorch tiling function, but only when it actually tiles. If you upscale something small and set it to not tile (on v0.12 that would be auto for a small image or none in general) the RAM usage stays small. But if you set a higher number of tiles (in v0.11, setting a target tile size), RAM usage explodes. I will investigate more.
Never mind, it seems it happens in general with an upscale node present. doesn't matter the settings.
I think you're right about it loading the libraries necessary for inference and then not releasing them. I'll see if there's anything I can do about that
@0x4E69676874466F78 Have you tried v0.12? If so, is the memory usage any better on that? ~3GB for PyTorch (GPU) is inevitable but it at least should use less overall memory when processing now.
@joeyballentine I installed it but haven't fully used it yet. Once there was a VRAM error with a model iterator.
If I added a load model node (onnx), loaded a model into it and then deleted node then the memory is not free.
Oh, this brings up a very interesting point. We need to send a request to clear cached starting nodes that have been deleted
I'll get around to checking it out a little later (one of these days).
@joeyballentine I found another mistakes:
- Leak on PyTorch nodes, I just change model in LOAD MODEL node many times (choose different models) and memory leaked. Deleting a node does not return memory.
- If I add an ONNX node, I set some model to it, then I add another node and set the same model, for some reason it is loaded into memory again (there is no logic for reusing the model).
I haven't tested NCNN yet.
On a MacMini M2 running Ventura I have noticed very heavy swap activity while ChaiNNer is running I have 16GB of physical ram and Activity Monitor has shown between 16 and 20 GB of "Swap Used" on occaision. Right now after a restart it is indicating only 416MB. A simple network is loaded but it has not run. When runthe results are as shown in the attached pdf. 20230302_213922.pdf
Does it not clear for you when its finished running? Upscaling via CPU is going to use a lot of ram as there is no VRAM to take advantage of
Going to close this issue as I believe everything related to the previous memory leak issues has ben resolved