jest
 jest copied to clipboard
Memory Leak on ridiculously simple repo
You guys do an awesome job and we all appreciate it! 🎉
🐛 Bug Report
On a work project we discovered a memory leak choking our CI machines. Going down the rabbit hole, I was able to recreate the memory leak using Jest alone.
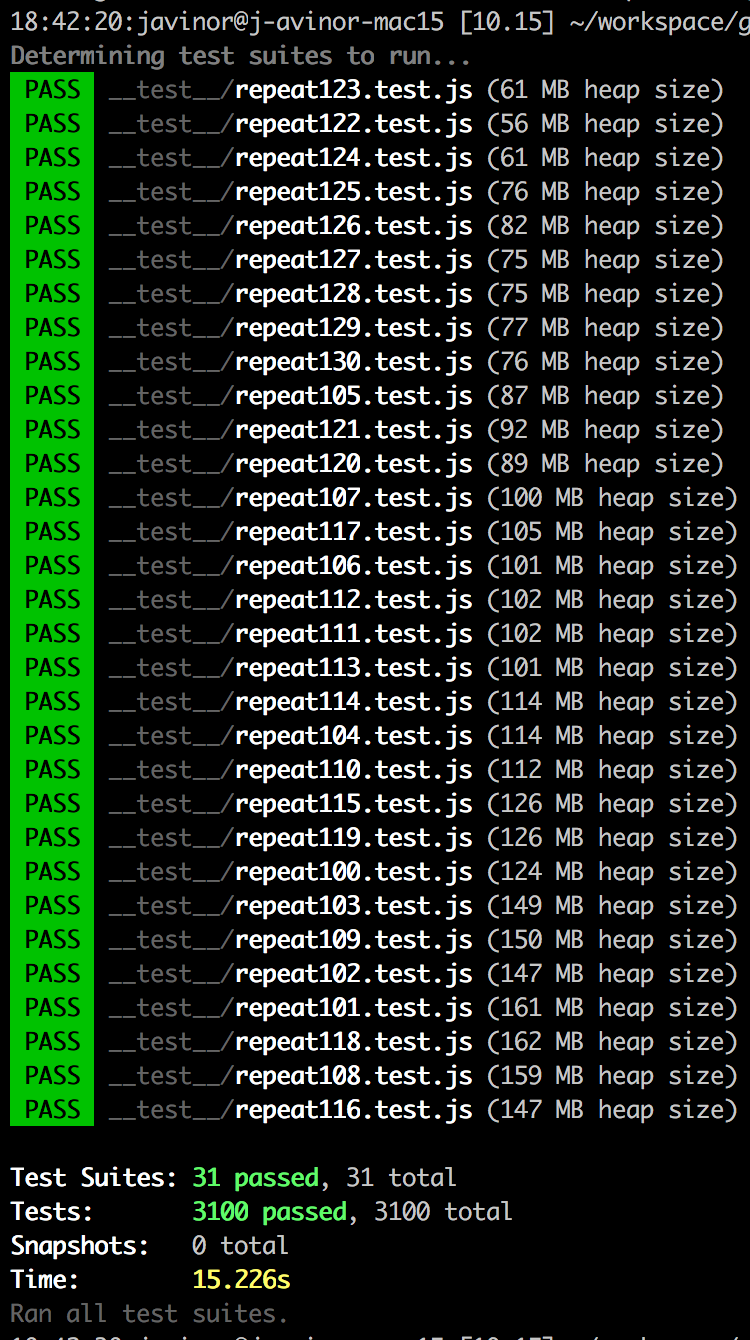
Running many test files causes a memory leak. I created a stupid simple repo with only Jest installed and 40 tautological test files.
I tried a number of solutions from https://github.com/facebook/jest/issues/7311 but to no avail. I couldn't find any solutions in the other memory related issues, and this seems like the most trivial repro I could find.
Workaround :'(
We run tests with --expose-gc flag and adding this to each test file:
afterAll(() => {
  global.gc && global.gc()
})
To Reproduce
Steps to reproduce the behavior:
git clone [email protected]:javinor/jest-memory-leak.git
cd jest-memory-leak
npm i
npm t
Expected behavior
Each test file should take the same amount of memory (give or take)
Link to repl or repo (highly encouraged)
https://github.com/javinor/jest-memory-leak
Run npx envinfo --preset jest
Paste the results here:
System:
    OS: macOS High Sierra 10.13.6
    CPU: (4) x64 Intel(R) Core(TM) i7-5557U CPU @ 3.10GHz
  Binaries:
    Node: 10.15.0 - ~/.nvm/versions/node/v10.15.0/bin/node
    Yarn: 1.12.3 - /usr/local/bin/yarn
    npm: 6.4.1 - ~/.nvm/versions/node/v10.15.0/bin/npm
  npmPackages:
    jest: ^24.1.0 => 24.1.0
I found this out recently but you can use the Chrome console to debug Node scripts! You can try using the Chrome console to profile Jest while it's running to try and dig into the issue.
I believe the command is: node --inspect ./node_modules/.bin/jest --watch -i. When running, open Chrome and go to about:inspect. You should then see the running Node script.
Do I understand correctly that using the workaround to force GC runs makes the heap size remain constant? In that case it's not really a memory leak, just v8 deciding not to run the GC because there is enough memory available. If I try running the repro with 50MB heap size
node --max_old_space_size=50 node_modules/.bin/jest --logHeapUsage --runInBand --config=jest.config.js
the tests still complete successfully, supporting this assumption.
@milesj I ran through some memory dumps, but couldn't make much sense of them, I'm not too experienced with pursuing leaks and I didn't want to point in the wrong direction without something solid to count on.
@jeysal you are right of course! The thing is our tests freeze in the middle of running since (I assume and could be wrong) we run out of memory. After spending a lot of time trying to figure this out, I found https://github.com/facebook/jest/issues/7274. It seemed to me from the discussion that the behaviour I encountered here is not intended. wdyt @SimenB ?
My tests are also leaking massively on CI but the exact same setup locally doesn't really leak (much at least).
It's so bad, I'm considering disabling tests on CI until I can make sense of what the difference is beside the OS. ):
Hey guys!
I simplified the memory leak case to a single file which runs tautological tests and eventually throws an exception due to a memory leak.
I'm not sure how to move forward with this... help? @SimenB @jeysal @milesj
[email protected] test /Users/javinor/workspace/jest-memory-leak
> jest --logHeapUsage --runInBand --config=jest.config.js


 RUNS  __test__/repeat100.test.js

<--- Last few GCs --->

[82597:0x103800000]    79124 ms: Mark-sweep 1259.1 (1442.2) -> 1240.0 (1436.2) MB, 438.3 / 0.0 ms  (average mu = 0.310, current mu = 0.304) allocation failure scavenge might not succeed
[82597:0x103800000]    79197 ms: Scavenge 1255.7 (1436.2) -> 1242.6 (1438.2) MB, 15.9 / 0.0 ms  (average mu = 0.310, current mu = 0.304) allocation failure
[82597:0x103800000]    79256 ms: Scavenge 1256.5 (1438.2) -> 1244.7 (1441.7) MB, 11.0 / 0.0 ms  (average mu = 0.310, current mu = 0.304) allocation failure


<--- JS stacktrace --->

==== JS stack trace =========================================

    0: ExitFrame [pc: 0x2440d84dbe3d]
Security context: 0x30802859e6e9 <JSObject>
    1: prepareStackTrace [0x3080c9459f79] [/Users/javinor/workspace/garbage/jest_leak/node_modules/source-map-support/source-map-support.js:~388] [pc=0x2440d854b545](this=0x308094d07b59 <JSFunction Error (sfi = 0x308018616e01)>,error=0x3080e18623f9 <Error map = 0x3080f3c619f9>,stack=0x3080e1862e91 <JSArray[23]>)
    2: InternalFrame [pc: 0x2440d848ee75]
    ...

FATAL ERROR: Ineffective mark-compacts near heap limit Allocation failed - JavaScript heap out of memory
 1: 0x10003c597 node::Abort() [/Users/javinor/.nvm/versions/node/v10.15.3/bin/node]
 2: 0x10003c7a1 node::OnFatalError(char const*, char const*) [/Users/javinor/.nvm/versions/node/v10.15.3/bin/node]
 3: 0x1001ad575 v8::internal::V8::FatalProcessOutOfMemory(v8::internal::Isolate*, char const*, bool) [/Users/javinor/.nvm/versions/node/v10.15.3/bin/node]
 4: 0x100579242 v8::internal::Heap::FatalProcessOutOfMemory(char const*) [/Users/javinor/.nvm/versions/node/v10.15.3/bin/node]
 5: 0x10057bd15 v8::internal::Heap::CheckIneffectiveMarkCompact(unsigned long, double) [/Users/javinor/.nvm/versions/node/v10.15.3/bin/node]
 6: 0x100577bbf v8::internal::Heap::PerformGarbageCollection(v8::internal::GarbageCollector, v8::GCCallbackFlags) [/Users/javinor/.nvm/versions/node/v10.15.3/bin/node]
 7: 0x100575d94 v8::internal::Heap::CollectGarbage(v8::internal::AllocationSpace, v8::internal::GarbageCollectionReason, v8::GCCallbackFlags) [/Users/javinor/.nvm/versions/node/v10.15.3/bin/node]
 8: 0x10058262c v8::internal::Heap::AllocateRawWithLigthRetry(int, v8::internal::AllocationSpace, v8::internal::AllocationAlignment) [/Users/javinor/.nvm/versions/node/v10.15.3/bin/node]
 9: 0x1005826af v8::internal::Heap::AllocateRawWithRetryOrFail(int, v8::internal::AllocationSpace, v8::internal::AllocationAlignment) [/Users/javinor/.nvm/versions/node/v10.15.3/bin/node]
10: 0x100551ff4 v8::internal::Factory::NewFillerObject(int, bool, v8::internal::AllocationSpace) [/Users/javinor/.nvm/versions/node/v10.15.3/bin/node]
11: 0x1007da044 v8::internal::Runtime_AllocateInNewSpace(int, v8::internal::Object**, v8::internal::Isolate*) [/Users/javinor/.nvm/versions/node/v10.15.3/bin/node]
12: 0x2440d84dbe3d
Abort trap: 6
Similar here, jest + ts-jest, simple tests get over 1GB of memory and eventually crash.
@javinor For a test file containing a ridiculous number of tests, I'm not sure there's much we can do, we have to keep the test objects around until the test file is finished - this is the heap while the tests are running:
 Hundreds of MBs of test objects, so for the case shown in this repro we can't really help either :/
FYI @scotthovestadt is currently working on holistically improving memory efficiency of Jest, so improvements are coming (some of them in the next minor version).
I wonder, why isn't it possible for Jest to spawn a process for each test file, which will guarantee that memory will be freed? Ok, it can be slower, of course, but in my case - it's much better to be slower rather than get a crash from out-of-memory and be blocked to use Jest alltogether...
Maybe an option? Or a separate "runner" (not sure if I understand architecture and terminology right)?
Is it architecturally possible?
Or, will Node-experimental-workers solve it?..
I've made a few improvements to memory in the next release: #8234 #8233
I have a future plan to improve memory in a couple of ways:
- by not holding onto test results at all, which are currently held until the end. related: #8242
- limiting number of modules that can exist in the require cache
The problem with your suggestion of just spawning a new worker for each test is that it would be very slow. A better suggestion along the same lines would be to monitor the memory usage of the processes and auto-restart them at some threshold. I have some concerns about that in general, I'd rather always fix memory leaks than paper them over, but if a PR did that I would accept it.
Let me know if the release next week helps with the problems you've been experiencing.
@scotthovestadt thanks for the info! I'll definitely check with the next release.
My actual issue is reported here: https://github.com/facebook/jest/issues/8247 And there I'm dealing with much bigger leaks, +30Mb per each test file (~150 files in my project).
Thanks for the responses guys!
I think I can break this down to different two problems:
- Memory consumption grows the more test files I have
- Memory consumption grows the more tests I have per file
We're running thousands of tests, each creating a relatively big setup so we get bitten twice.
The original screenshot showing the consumption growing from test file to test file, hinting to a leak between tests - I have a few guesses as to why this happens, but nothing solid yet.
The exception I referred to later, as far as I can tell, really has to do with what @jeysal pointed out - having a large number of tests in the file. In our case, we have only hundreds of tests but with a very large setup. I'll try to provide a better reproduction of this.
I'll update after the next release, when I get to poke around a bit more and see the additional fixes in action. Thanks guys!
There must be something else wrong because I'm currently using Jest v23.6 and everything works fine, no memory leaks, no anything.
If I upgrade to latest Jest then the memory leaks start to happen, but only on the GiLab CI runner. Works fine locally.
Meh, it's still leaking in my setup ):
[0KRunning with gitlab-runner 11.8.0 (4745a6f3)
[0;m[0K  on the-mill-ec2-gitlab-runner GvW8cLGR
[0;m[0KUsing Docker executor with image cypress/base:8 ...
[0;m[0KUsing locally found image version due to if-not-present pull policy
[0;m[0KUsing docker image sha256:2ad7a04a3a1d41fac2585d88e2dbd19ed3df9c57df2b27276c30e4f317c2c8e3 for cypress/base:8 ...
[0;msection_start:1554216455:prepare_script
[0KRunning on runner-GvW8cLGR-project-10463077-concurrent-0 via runner-gvw8clgr-gitlab-runner-1554212599-0c63c2c8...
section_end:1554216456:prepare_script
[0Ksection_start:1554216456:get_sources
[0K[32;1mCloning repository...[0;m
Cloning into '/builds/the-mill/lambda-gaming'...
[32;1mChecking out a592f4d2 as update-fe-bo-packages...[0;m
[32;1mSkipping Git submodules setup[0;m
section_end:1554216459:get_sources
[0Ksection_start:1554216459:restore_cache
[0Ksection_end:1554216460:restore_cache
[0Ksection_start:1554216460:download_artifacts
[0K[32;1mDownloading artifacts for nodeModulesFe (189107055)...[0;m
Downloading artifacts from coordinator... ok      [0;m  id[0;m=189107055 responseStatus[0;m=200 OK token[0;m=iQz-3io7
section_end:1554216481:download_artifacts
[0Ksection_start:1554216481:build_script
[0K[32;1m$ cd ./packages/frontends[0;m
[32;1m$ node --version[0;m
v8.12.0
[32;1m$ node --expose-gc ./node_modules/.bin/ng test --ci --code-coverage=false --run-in-band[0;m
PASS apps/whitelabel/src/app/app.component.spec.ts (195 MB heap size)
  AppComponent
    ✓ should create the app (87ms)

Test Suites: 1 passed, 1 total
Tests:       1 passed, 1 total
Snapshots:   0 total
Time:        5.168s
Ran all test suites.
PASS apps/backoffice/src/app/layout/layout.component.spec.ts (294 MB heap size)
PASS apps/backoffice/src/app/app.component.spec.ts (289 MB heap size)

Test Suites: 2 passed, 2 total
Tests:       3 passed, 3 total
Snapshots:   1 passed, 1 total
Time:        4.154s
Ran all test suites.
PASS libs/api/src/lib/api.module.spec.ts (364 MB heap size)
  ApiModule
    ✓ should create (69ms)

Test Suites: 1 passed, 1 total
Tests:       1 passed, 1 total
Snapshots:   0 total
Time:        3.283s
Ran all test suites.
PASS libs/core/src/lib/user.service.spec.ts (427 MB heap size)
PASS libs/core/src/lib/auth.service.spec.ts (426 MB heap size)
PASS libs/core/src/lib/wallet.service.spec.ts (426 MB heap size)
PASS libs/core/src/lib/unauth.guard.spec.ts (428 MB heap size)
PASS libs/core/src/lib/auth.guard.spec.ts (428 MB heap size)
PASS libs/core/src/lib/route.service.spec.ts (426 MB heap size)
PASS libs/core/src/lib/core.module.spec.ts (426 MB heap size)

Test Suites: 7 passed, 7 total
Tests:       8 passed, 8 total
Snapshots:   0 total
Time:        6.945s
Ran all test suites.
PASS libs/ui/src/lib/form-errors/form-errors.component.spec.ts (507 MB heap size)
PASS libs/ui/src/lib/loader/loader.component.spec.ts (507 MB heap size)
PASS libs/ui/src/lib/css-url.pipe.spec.ts (506 MB heap size)
PASS libs/ui/src/lib/ui.module.spec.ts (526 MB heap size)

Test Suites: 4 passed, 4 total
Tests:       6 passed, 6 total
Snapshots:   2 passed, 2 total
Time:        6.525s
Ran all test suites.
PASS libs/registration/src/lib/registration-form/registration-form.component.spec.ts (5.068s, 633 MB heap size)
PASS libs/registration/src/lib/registration.module.spec.ts (628 MB heap size)

Test Suites: 2 passed, 2 total
Tests:       3 passed, 3 total
Snapshots:   1 passed, 1 total
Time:        7.861s
Ran all test suites.
PASS libs/casino-game/src/lib/casino-game/casino-game.component.spec.ts (687 MB heap size)
PASS libs/casino-game/src/lib/casino-game.module.spec.ts (685 MB heap size)

Test Suites: 2 passed, 2 total
Tests:       4 passed, 4 total
Snapshots:   1 passed, 1 total
Time:        3.839s
Ran all test suites.
PASS libs/documents/src/lib/document-upload-form/document-upload-form.component.spec.ts (736 MB heap size)
PASS libs/documents/src/lib/documents/documents.component.spec.ts (736 MB heap size)
PASS libs/documents/src/lib/documents.module.spec.ts (736 MB heap size)

Test Suites: 3 passed, 3 total
Tests:       5 passed, 5 total
Snapshots:   2 passed, 2 total
Time:        4.32s
Ran all test suites.
PASS libs/forgot-password/src/lib/forgot-password-form/forgot-password-form.component.spec.ts (818 MB heap size)
PASS libs/forgot-password/src/lib/forgot-password/forgot-password.component.spec.ts (818 MB heap size)
PASS libs/forgot-password/src/lib/forgot-password.module.spec.ts (837 MB heap size)

Test Suites: 3 passed, 3 total
Tests:       5 passed, 5 total
Snapshots:   2 passed, 2 total
Time:        7.06s
Ran all test suites.
PASS libs/reset-password/src/lib/reset-password-form/reset-password-form.component.spec.ts (922 MB heap size)
PASS libs/reset-password/src/lib/reset-password/reset-password.component.spec.ts (919 MB heap size)
PASS libs/reset-password/src/lib/reset-password.module.spec.ts (929 MB heap size)

Test Suites: 3 passed, 3 total
Tests:       5 passed, 5 total
Snapshots:   2 passed, 2 total
Time:        7.922s
Ran all test suites.
PASS libs/payment/src/lib/payment-process/payment-process.component.spec.ts (1018 MB heap size)
PASS libs/payment/src/lib/payment-option-list/payment-option-list.component.spec.ts (1016 MB heap size)
PASS libs/payment/src/lib/payment-option/payment-option.component.spec.ts (1011 MB heap size)
PASS libs/payment/src/lib/card-form/card-form.component.spec.ts (1013 MB heap size)
PASS libs/payment/src/lib/payment.service.spec.ts (1013 MB heap size)
PASS libs/payment/src/lib/payment.module.spec.ts (1032 MB heap size)
PASS libs/payment/src/lib/card-type-detector.directive.spec.ts (1023 MB heap size)

Test Suites: 7 passed, 7 total
Tests:       11 passed, 11 total
Snapshots:   4 passed, 4 total
Time:        14.741s
Ran all test suites.
PASS libs/fluid-container/src/lib/fluid-container/fluid-container.component.spec.ts (1081 MB heap size)
PASS libs/fluid-container/src/lib/fluid-container.module.spec.ts (1081 MB heap size)

Test Suites: 2 passed, 2 total
Tests:       3 passed, 3 total
Snapshots:   1 passed, 1 total
Time:        4.164s
Ran all test suites.
PASS libs/layout/src/lib/layout/layout.component.spec.ts (6.025s, 1181 MB heap size)
FAIL libs/layout/src/lib/sidebar/sidebar.component.spec.ts
  ● Test suite failed to run

    TypeScript diagnostics (customize using `[jest-config].globals.ts-jest.diagnostics` option):
    [96mlibs/layout/src/lib/sidebar/sidebar.component.spec.ts[0m:[93m26[0m:[93m7[0m - [91merror[0m[90m TS2739: [0mType '{ __typename: "NavList"; classes: string[]; navListItems: undefined[]; }' is missing the following properties from type 'NavList': horizontal, id

    [7m26[0m       navList: {
    [7m  [0m [91m      ~~~~~~~[0m

      [96mlibs/layout/src/lib/sidebar/sidebar.graphql.ts[0m:[93m8[0m:[93m3[0m
        [7m8[0m   navList: NavList;
        [7m [0m [96m  ~~~~~~~[0m
        The expected type comes from property 'navList' which is declared here on type 'Sidebar'

PASS libs/layout/src/lib/header/header.component.spec.ts (1213 MB heap size)
PASS libs/layout/src/lib/footer/footer.component.spec.ts (1194 MB heap size)
PASS libs/layout/src/lib/layout.module.spec.ts (5.055s, 1212 MB heap size)

Test Suites: 1 failed, 4 passed, 5 total
Tests:       7 passed, 7 total
Snapshots:   3 passed, 3 total
Time:        19.157s
Ran all test suites.
PASS libs/cms/src/lib/page/page.component.spec.ts (7.531s, 1269 MB heap size)
PASS libs/cms/src/lib/dialog-route/dialog-route.component.spec.ts (1271 MB heap size)
PASS libs/cms/src/lib/content-group/content-group.component.spec.ts (1272 MB heap size)
PASS libs/cms/src/lib/cms.service.spec.ts (1270 MB heap size)
PASS libs/cms/src/lib/slot.directive.spec.ts (1268 MB heap size)
PASS libs/cms/src/lib/cms.module.spec.ts (1270 MB heap size)

Test Suites: 6 passed, 6 total
Tests:       9 passed, 9 total
Snapshots:   3 passed, 3 total
Time:        18.367s
Ran all test suites.
FATAL ERROR: CALL_AND_RETRY_LAST Allocation failed - JavaScript heap out of memory

<--- Last few GCs --->

[10:0x2510510]   136242 ms: Mark-sweep 1362.8 (1460.0) -> 1362.8 (1460.0) MB, 1827.9 / 0.1 ms  allocation failure GC in old space requested
[10:0x2510510]   137760 ms: Mark-sweep 1362.8 (1460.0) -> 1362.8 (1429.0) MB, 1518.2 / 0.1 ms  last resort GC in old space requested
[10:0x2510510]   139285 ms: Mark-sweep 1362.8 (1429.0) -> 1362.8 (1429.0) MB, 1524.6 / 0.1 ms  last resort GC in old space requested


<--- JS stacktrace --->

==== JS stack trace =========================================

Security context: 0xb1cf5fa5879 <JSObject>
    1: stringSlice(aka stringSlice) [buffer.js:560] [bytecode=0x1e161b35dd29 offset=94](this=0x11a4d26822d1 <undefined>,buf=0x20928062d71 <Uint8Array map = 0x35a39b242941>,encoding=0xb1cf5fb5409 <String[4]: utf8>,start=0,end=1097377)
    2: toString [buffer.js:633] [bytecode=0x1e161b35d979 offset=145](this=0x20928062d71 <Uint8Array map = 0x35a39b242941>,encoding=0xb1cf5fb5409 <String[4]: utf8>,st...

 1: node::Abort() [ng test --ci --code-coverage=false --run-in-band]
 2: 0x8cbf4c [ng test --ci --code-coverage=false --run-in-band]
 3: v8::Utils::ReportOOMFailure(char const*, bool) [ng test --ci --code-coverage=false --run-in-band]
 4: v8::internal::V8::FatalProcessOutOfMemory(char const*, bool) [ng test --ci --code-coverage=false --run-in-band]
 5: v8::internal::Factory::NewRawTwoByteString(int, v8::internal::PretenureFlag) [ng test --ci --code-coverage=false --run-in-band]
 6: v8::internal::Factory::NewStringFromUtf8(v8::internal::Vector<char const>, v8::internal::PretenureFlag) [ng test --ci --code-coverage=false --run-in-band]
 7: v8::String::NewFromUtf8(v8::Isolate*, char const*, v8::NewStringType, int) [ng test --ci --code-coverage=false --run-in-band]
 8: node::StringBytes::Encode(v8::Isolate*, char const*, unsigned long, node::encoding, v8::Local<v8::Value>*) [ng test --ci --code-coverage=false --run-in-band]
 9: 0x8e4a76 [ng test --ci --code-coverage=false --run-in-band]
10: v8::internal::FunctionCallbackArguments::Call(void (*)(v8::FunctionCallbackInfo<v8::Value> const&)) [ng test --ci --code-coverage=false --run-in-band]
11: 0xb0bbec [ng test --ci --code-coverage=false --run-in-band]
12: v8::internal::Builtin_HandleApiCall(int, v8::internal::Object**, v8::internal::Isolate*) [ng test --ci --code-coverage=false --run-in-band]
13: 0x220bb08042fd
/bin/bash: line 90:    10 Aborted                 (core dumped) node --expose-gc ./node_modules/.bin/ng test --ci --code-coverage=false --run-in-band
section_end:1554216631:build_script
[0Ksection_start:1554216631:after_script
[0Ksection_end:1554216633:after_script
[0Ksection_start:1554216633:upload_artifacts_on_failure
[0K[32;1mUploading artifacts...[0;m
[0;33mWARNING: ./packages/frontends/junit/*.xml: no matching files[0;m
[31;1mERROR: No files to upload                         [0;m
section_end:1554216634:upload_artifacts_on_failure
[0K[31;1mERROR: Job failed: exit code 1
[0;m
After updating to 24.6.0, we are seeing the similar issue running our CI tests. When logging the heap usage, we see an increase of memory usage after each test file.
This should help: https://github.com/facebook/jest/pull/8282
Will be released soon.
The problem with your suggestion of just spawning a new worker for each test is that it would be very slow.
This would also be a huge breaking change.
If I upgrade to latest Jest then the memory leaks start to happen, but only on the GiLab CI runner. Works fine locally.
Also encounter out of memory issue with jest + ts-jest:
https://circleci.com/gh/unional/standard-log/382
Originally I thought it was some circular dependency on my source code, but may be jest related.
So throwing this into the mix. 🌷
@unional if you're on Circle, make sure maxWorkers isn't higher than the CPU allotted you by Circle.
EDIT: To be clear, you should proactively specify maxWorkers at or below the CPU allotted you Circle.
@Supernats thanks. I think I did have that set during the failure, currently I'm running it with --runInBand 😢
But it still fail once in a while: https://circleci.com/gh/unional/standard-log/448
I have Jest 24.8.0 and #8282 doesn't seem to help. Also --runInBand only helps a bit (4 GB instead of 10 GB 😮).
Pleaaaaaaase fix this ...
Yes, following this thread for long since it still fails for us and in ~10% of the cases runs with "out of memory" for CircleCI 2Gb RAM instances.
Found an article for how to use heap snapshot to debug jest memory leak here: https://chanind.github.io/javascript/2019/10/12/jest-tests-memory-leak.html I tried to use the same method to debug but didn't find the root cause.
Even global.gc() does not help for me, still seeing heap size keeps growing for each test.
Found an article for how to use heap snapshot to debug jest memory leak here: https://chanind.github.io/javascript/2019/10/12/jest-tests-memory-leak.html I tried to use the same method to debug but didn't find the root cause.
Even
global.gc()does not help for me, still seeing heap size keeps growing for each test.
Very useful, thanks!