opentelemetry-plugin
 opentelemetry-plugin copied to clipboard
Monitor and observe Jenkins with OpenTelemetry.
Jenkins OpenTelemetry Plugin


Introduction
Monitor and observe Jenkins with OpenTelemetry.
Visualize jobs and pipelines executions as distributed traces:
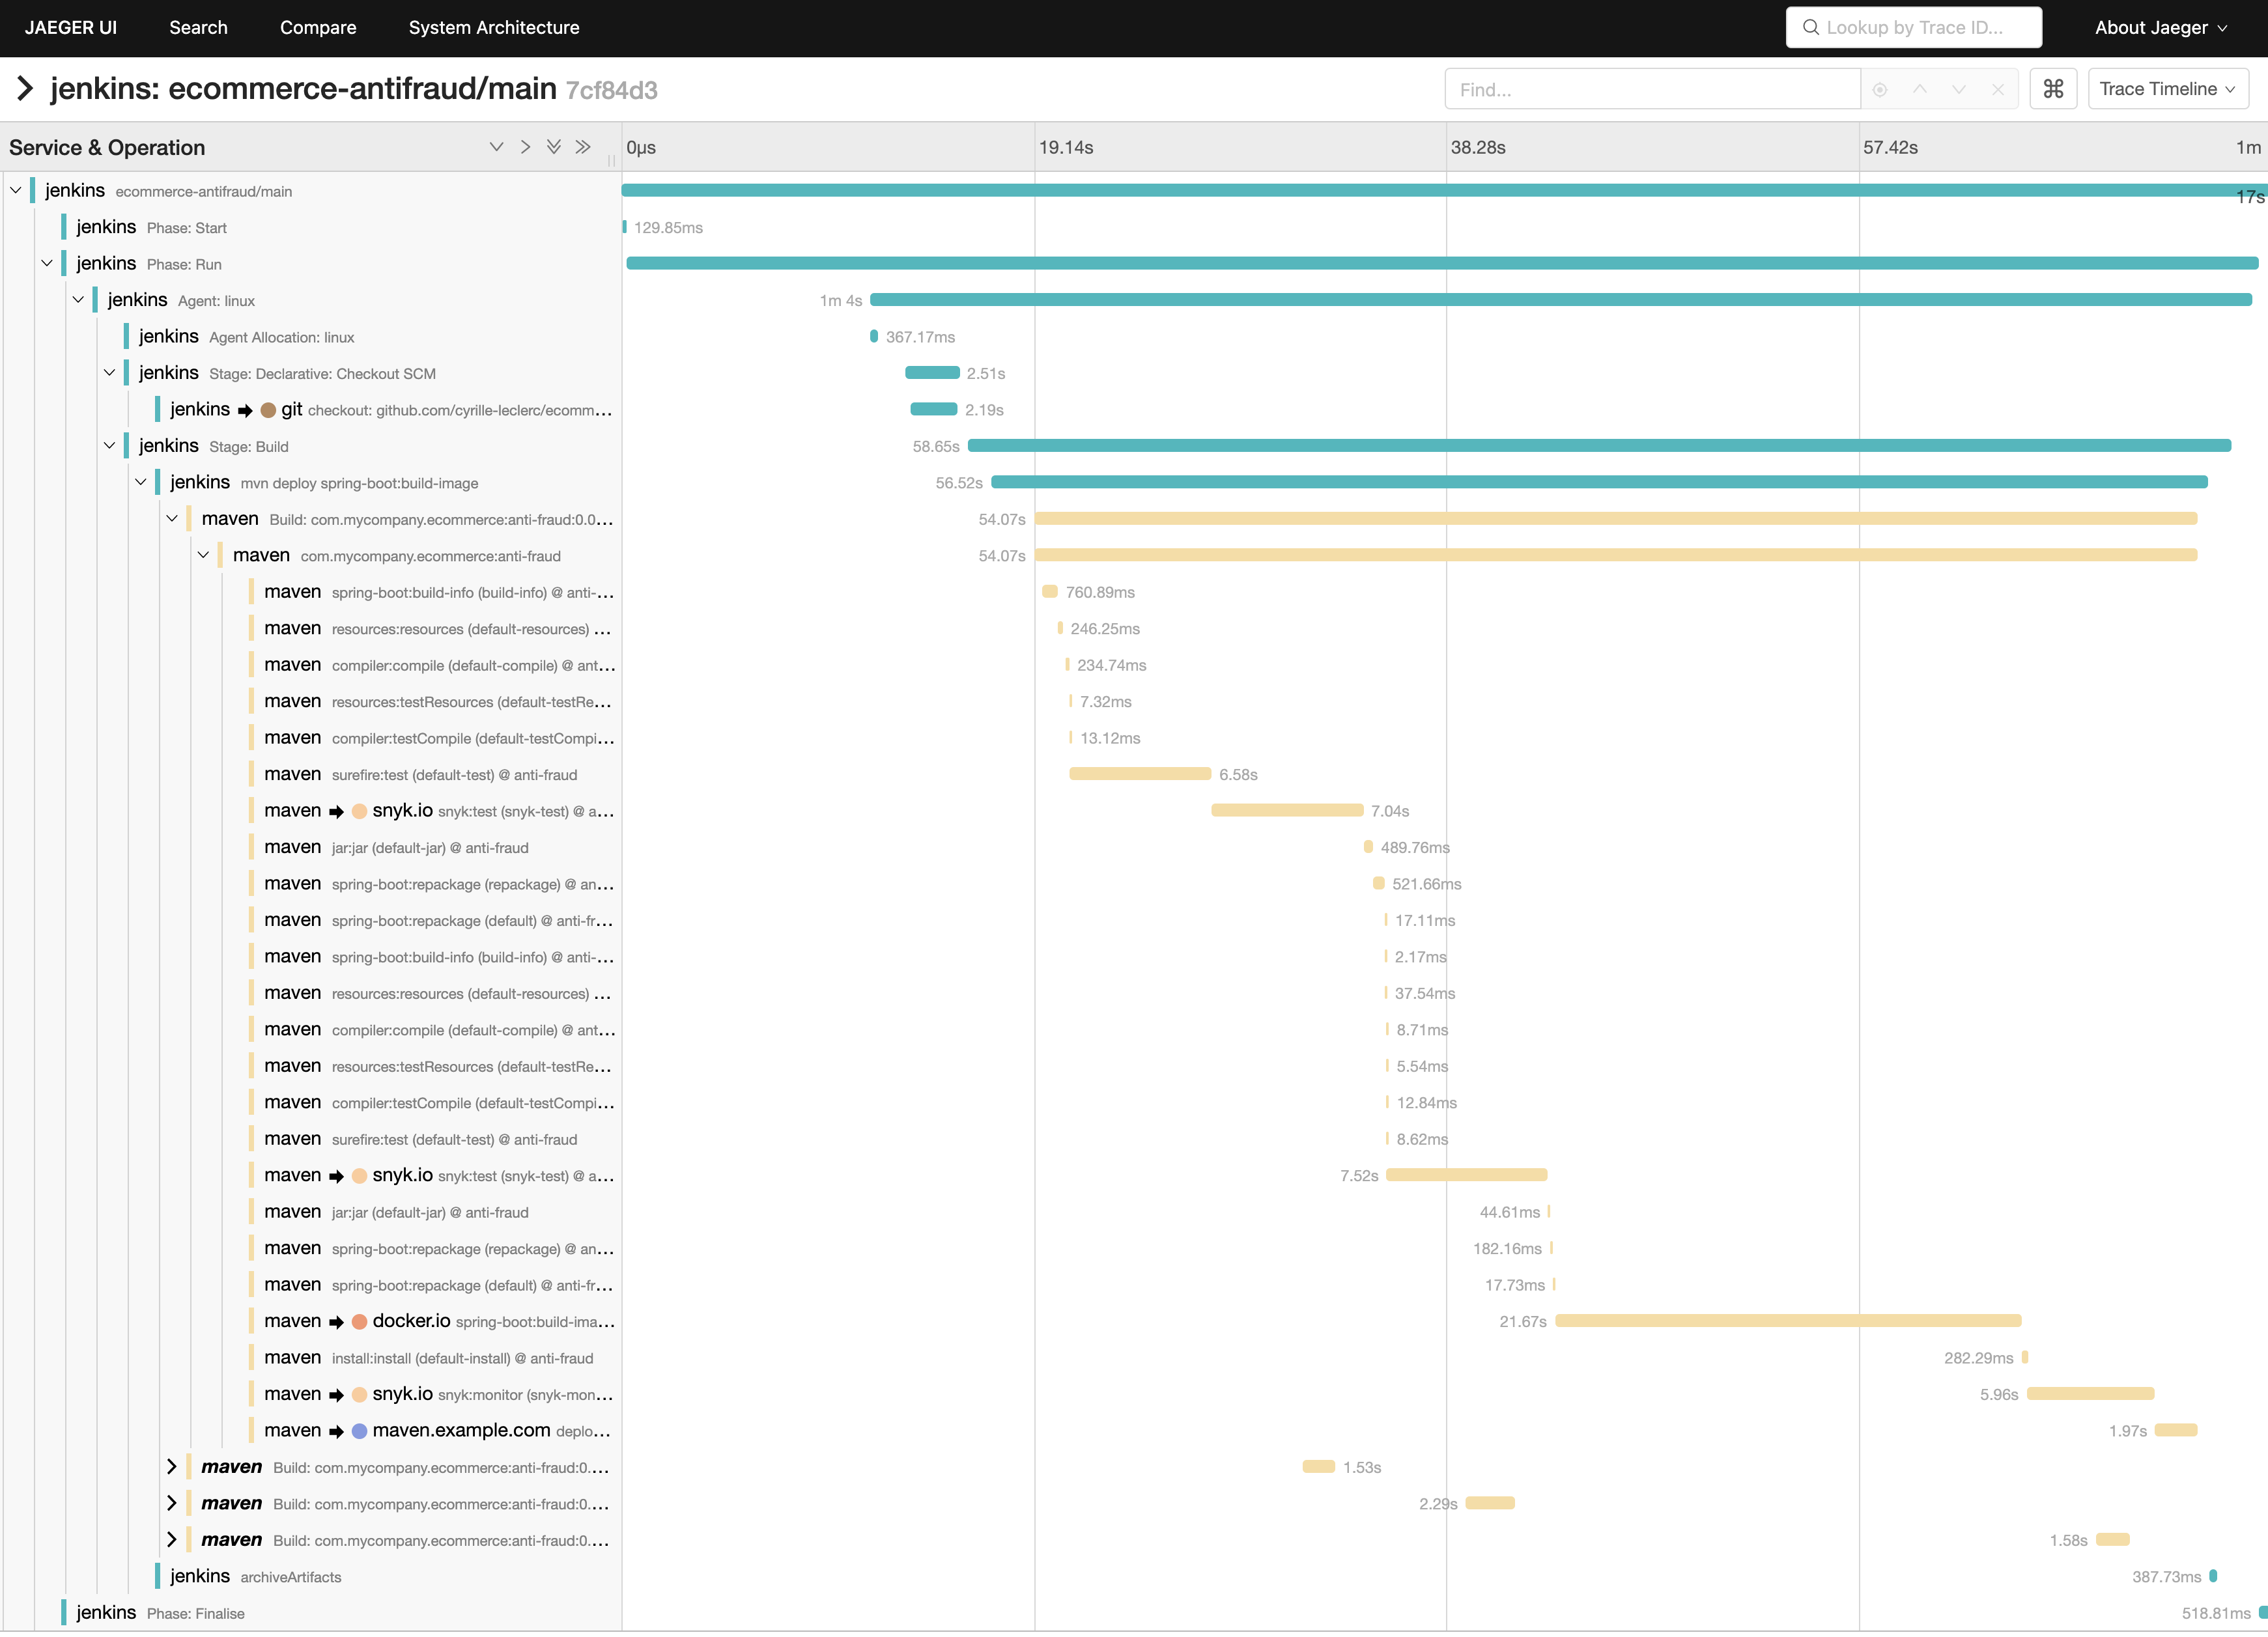
Example pipeline execution trace of a SpringBoot Maven going application
Visualize Jenkins and pipeline health indicators:
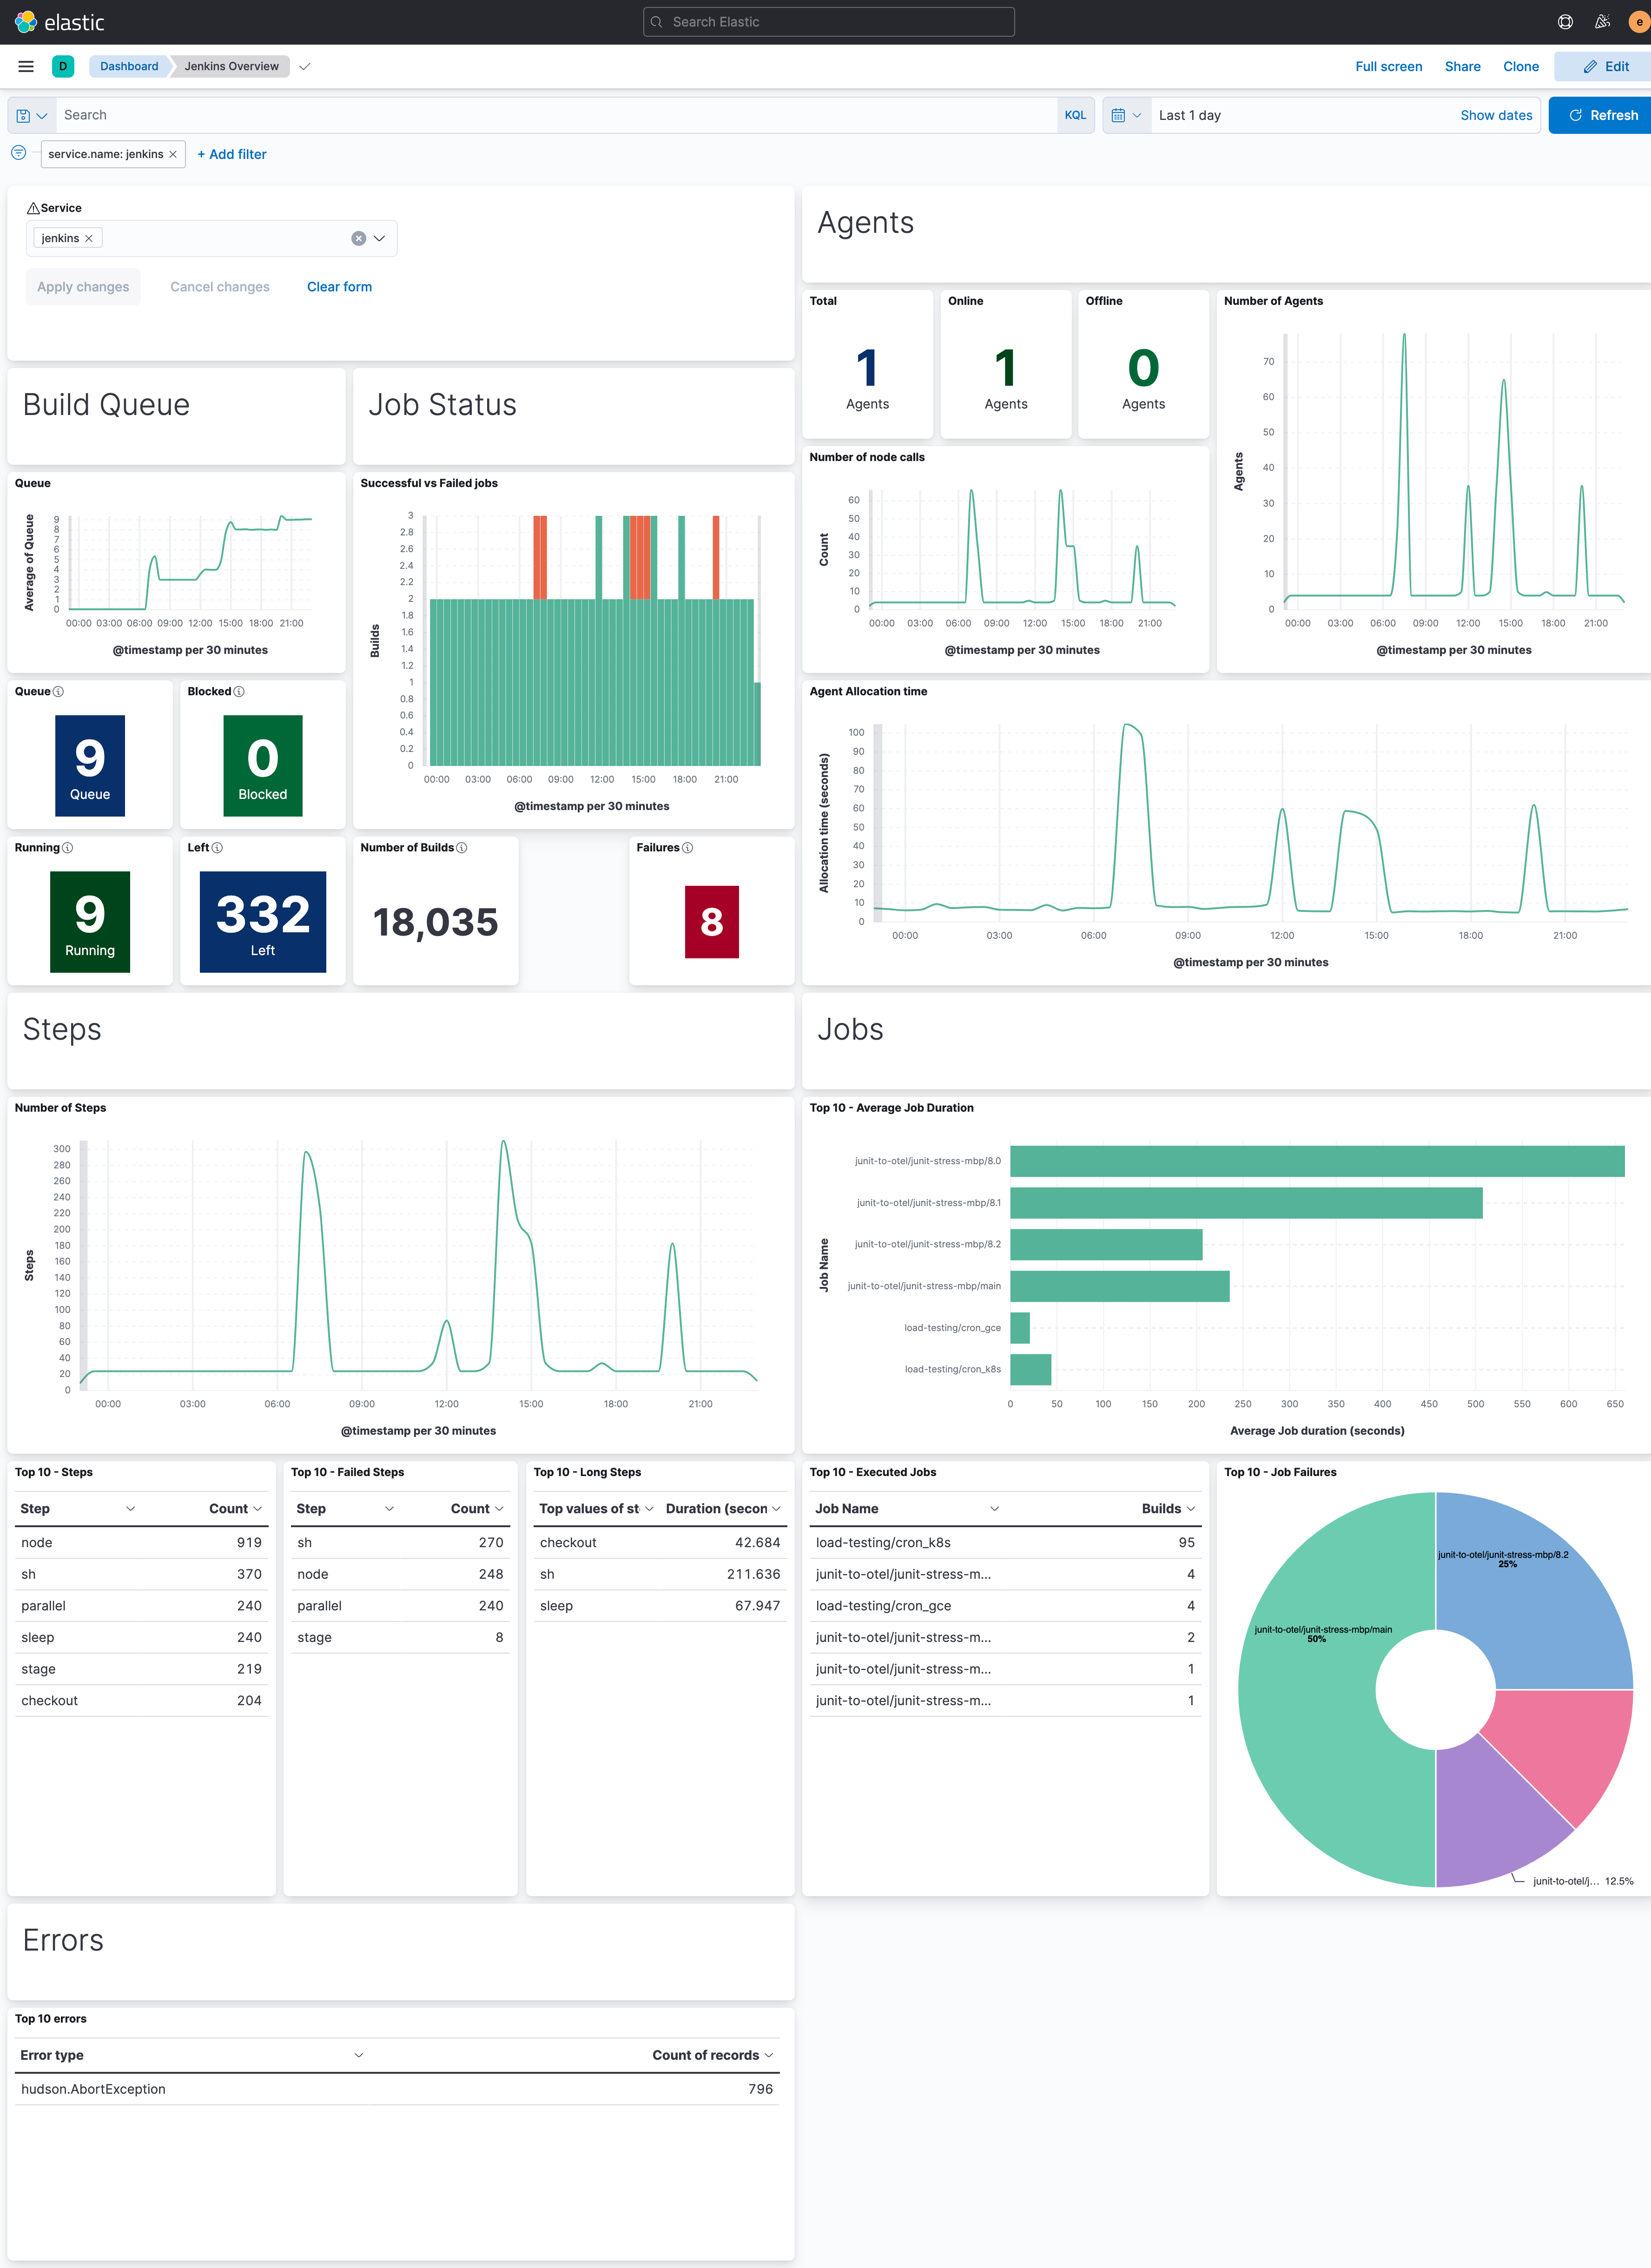
Example Kibana dashboard of the Jenkins and CI jobs health
Troubleshoot Jenkins performances with distributed tracing of HTTPs requests:
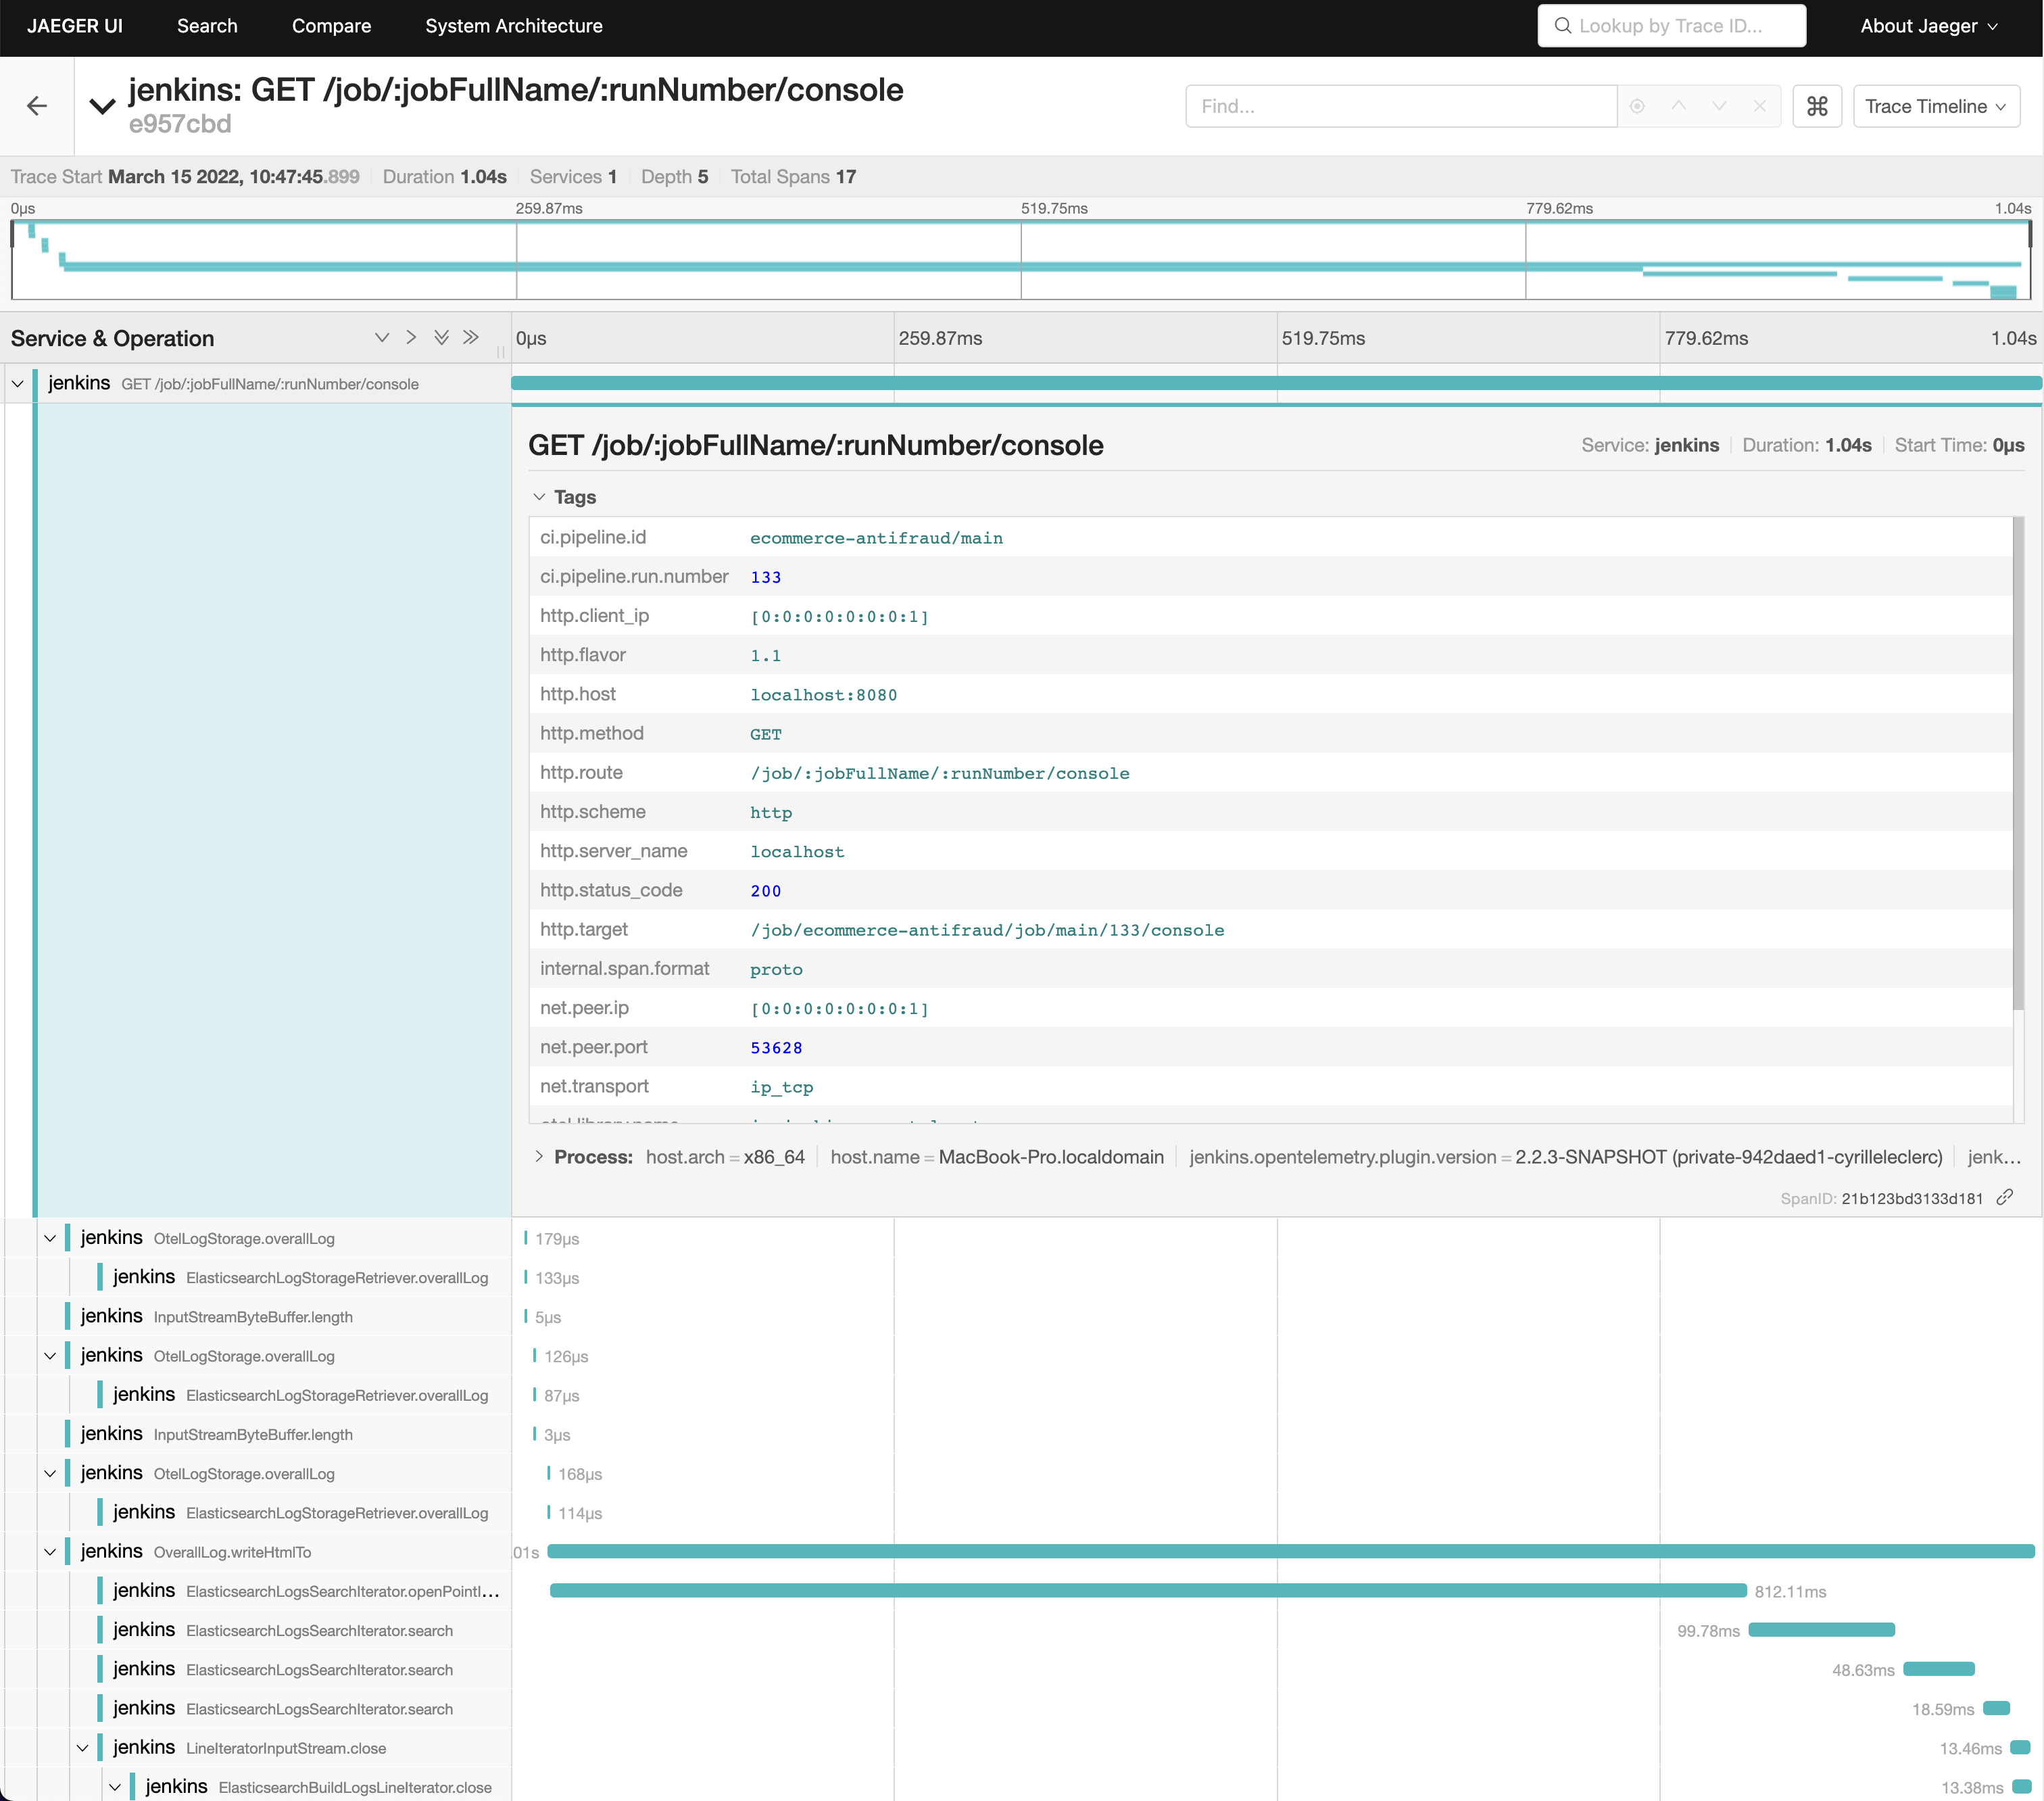
Example Jenkins HTTP trace
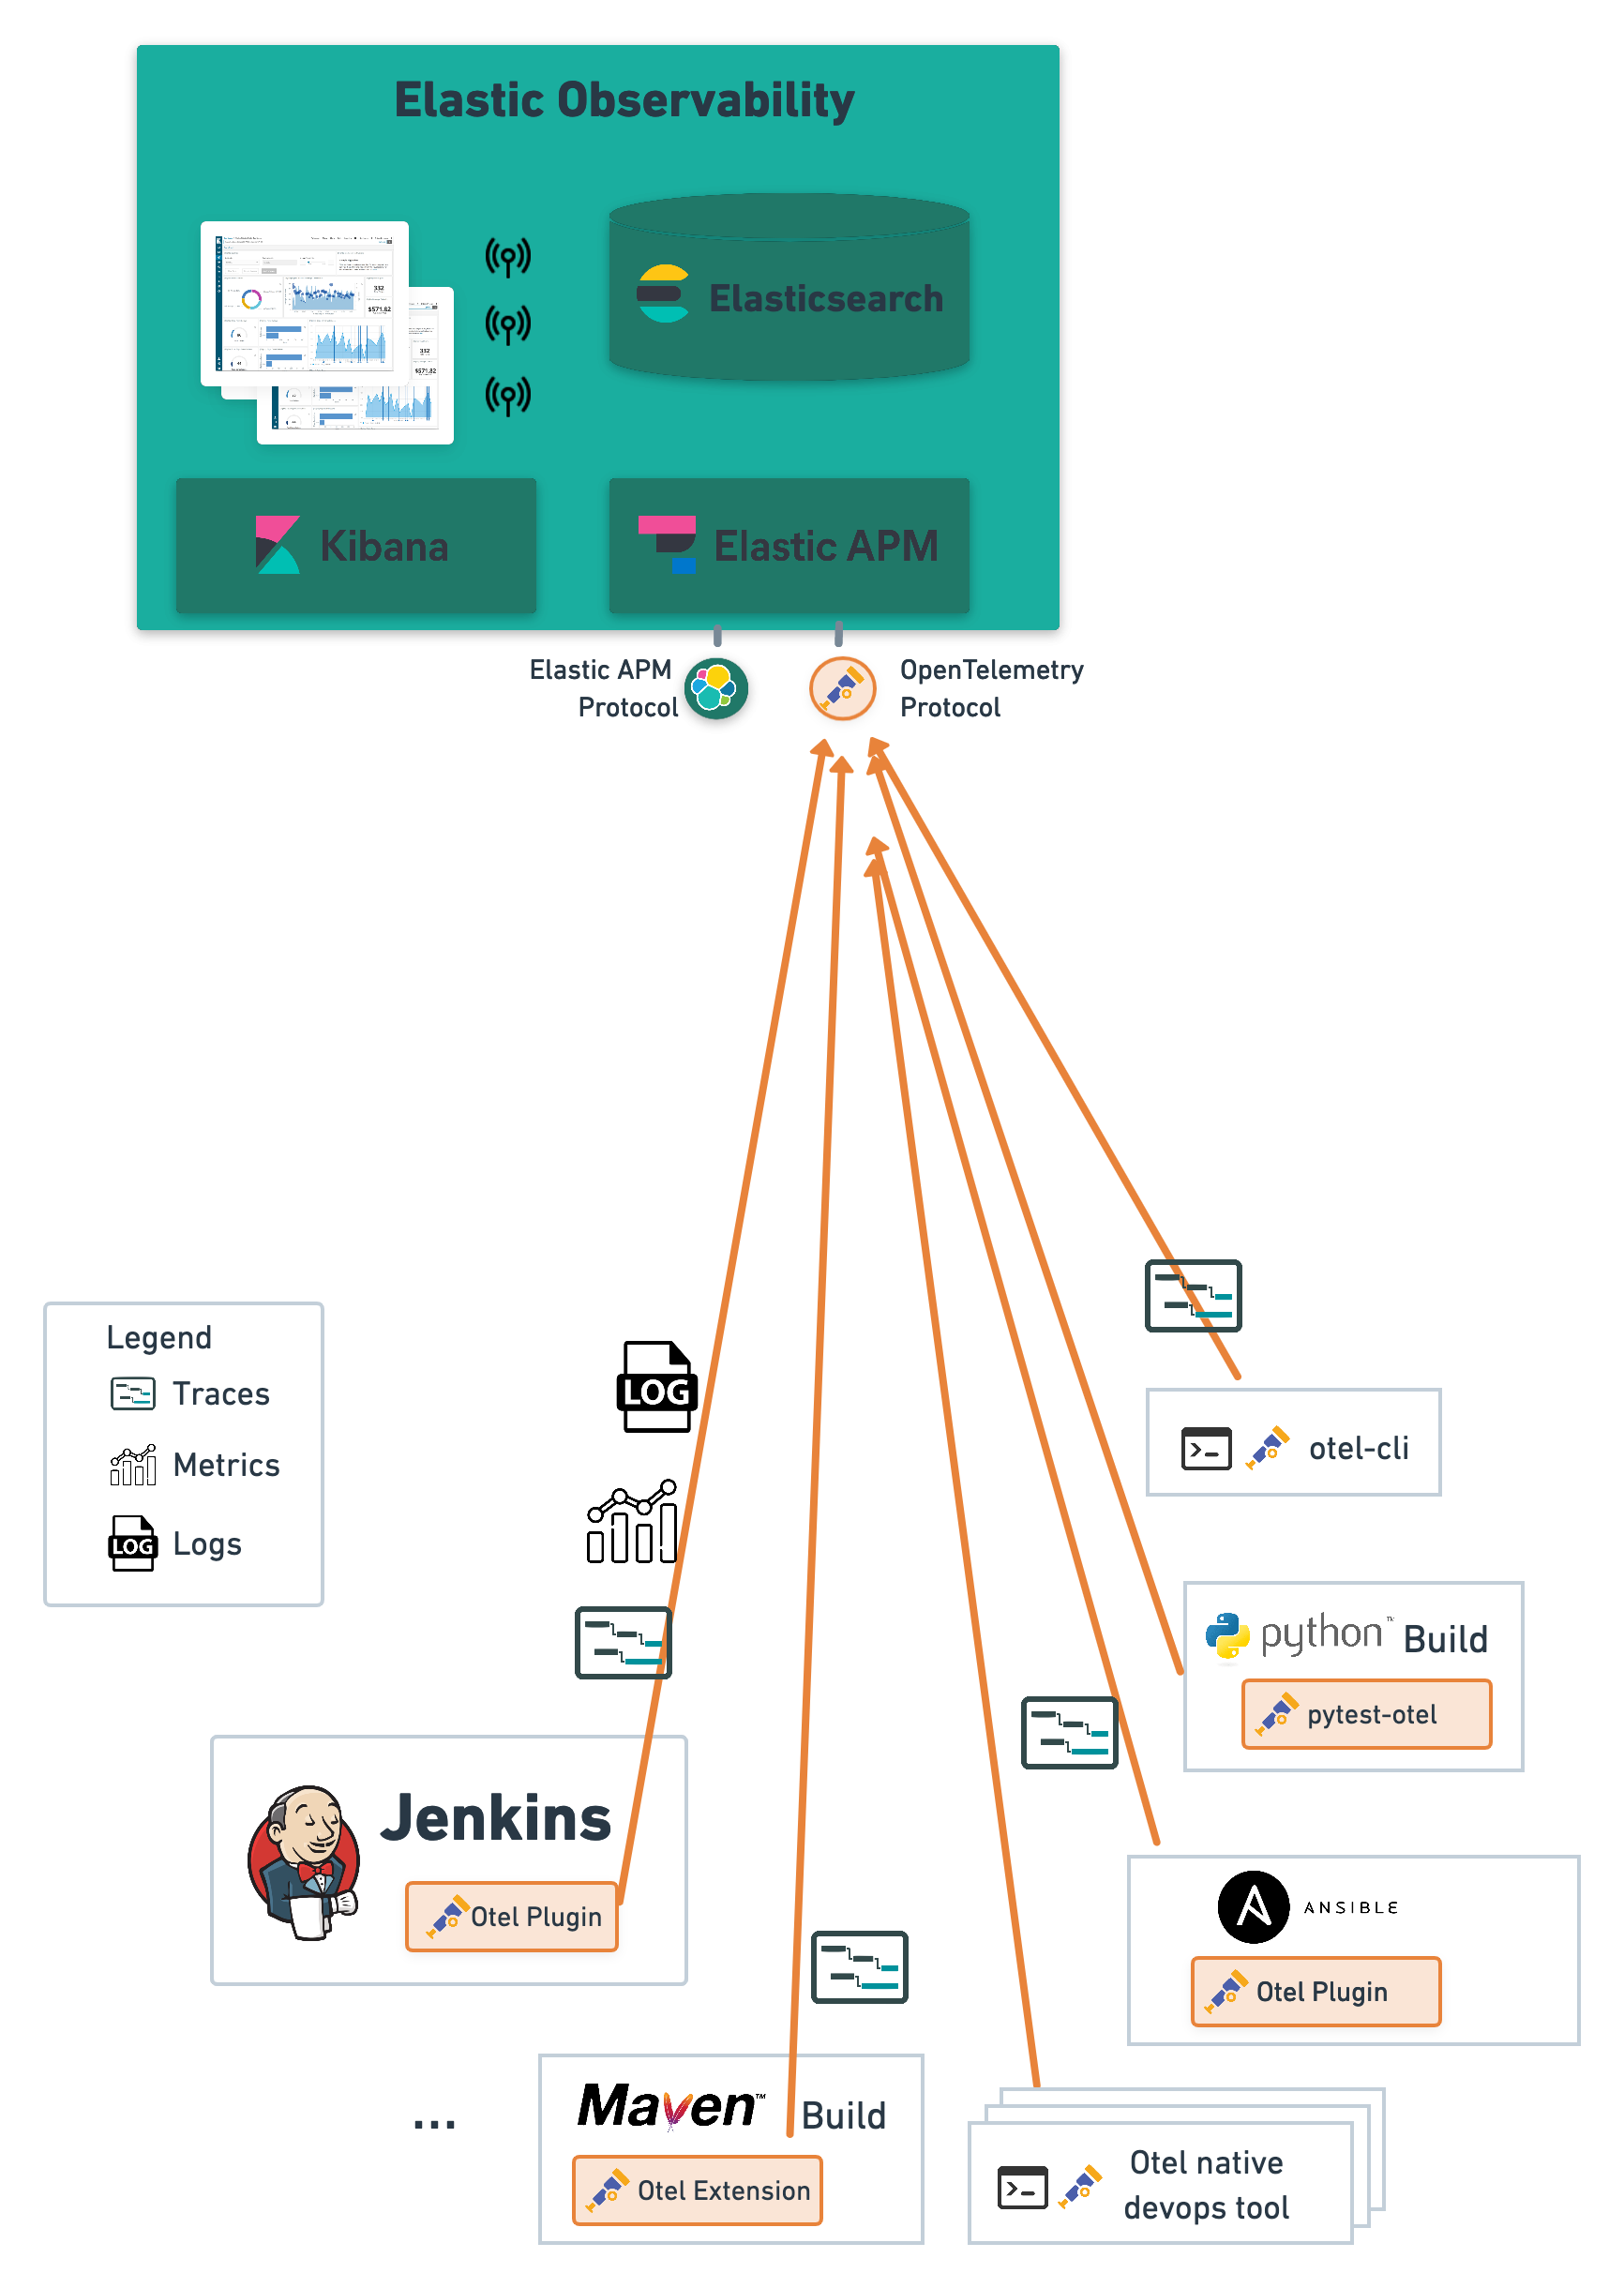
Architecture
Using the OpenTelemetry Collector, you can use many monitoring backends to monitor Jenkins such as Jaeger, Zipkin, Prometheus, Elastic Observability and many others listed here.
Here are example architectures with Elastic, Jaeger, and Prometheus:
| CI/CD Observability with Jaeger and Prometheus | CI/CD Observability with Elastic |
|---|---|
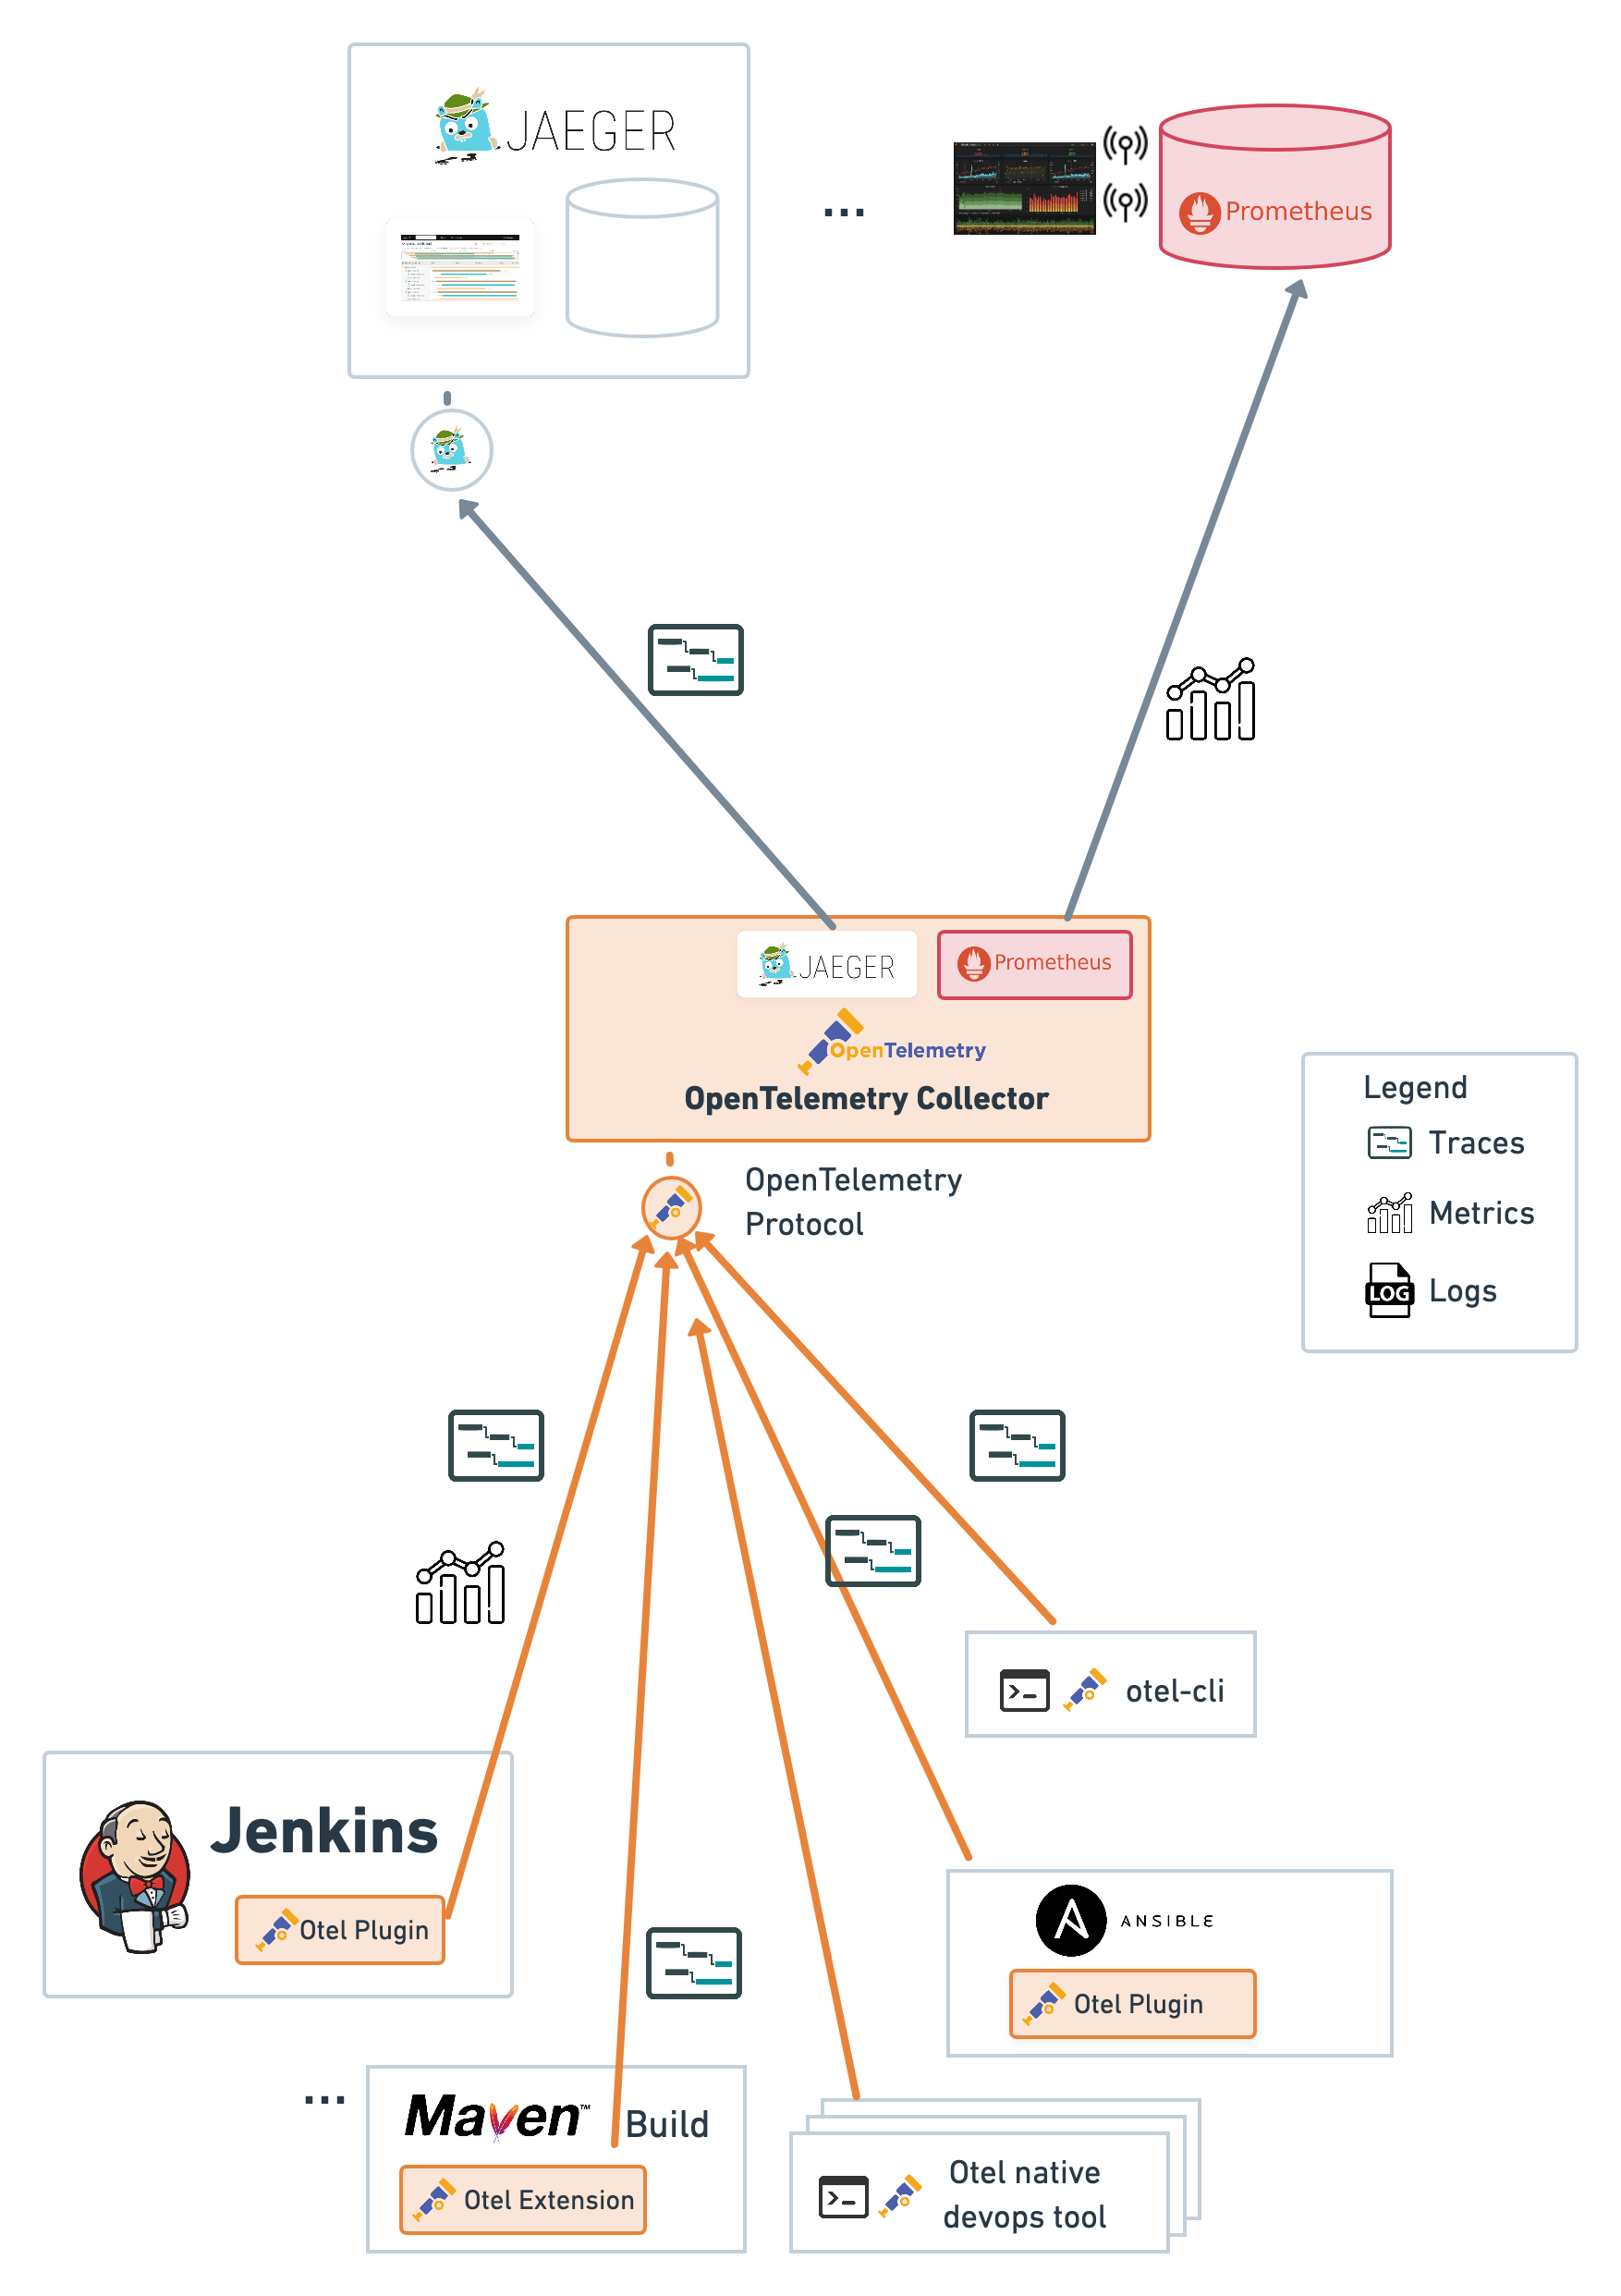 |
 |
Getting started
- Set up an OpenTelemetry endpoint such as the OpenTelemetry Collector
- Install the Jenkins OpenTelemetry plugin
- Configure the Jenkins OpenTelemetry plugin navigating to the "Manage Jenkins / Configure System" screen. In the OpenTelemetry section define:
- "OTLP Endpoint": the hostname and port of the OpenTelemetry GRPC Protocol (OTLP GRPC) endpoint, typically an OpenTelemetry Collector or directly an Observability backend that supports the OTLP GRPC protocol
- "Authentication": authentication mechanism used by your OTLP Endpoint
- "Header Authentication" : name of the authentication header if header based authentication is used.
- "Bearer Token Authentication": Bearer token when using header based authentication. Note that Elastic APM token authentication uses a "Bearer Token Authentication".
- "No Authentication"
- Check "Export OpenTelemetry configuration as environment variables" to easily integrate visibility in other build tools (see the otel-cli, the OpenTelemetry Maven extension, the OpenTelemetry Ansible integration...)
- Visualization: add the backend used to visualize job executions as traces.
- Elastic Observability
- Jaeger
- Zipkin
- Custom Observability backend for other visualization solutions
- Set up Jenkins health dashboards on your OpenTelemetry metrics visualization solution. See details including guidance for Elastic Kibana here.
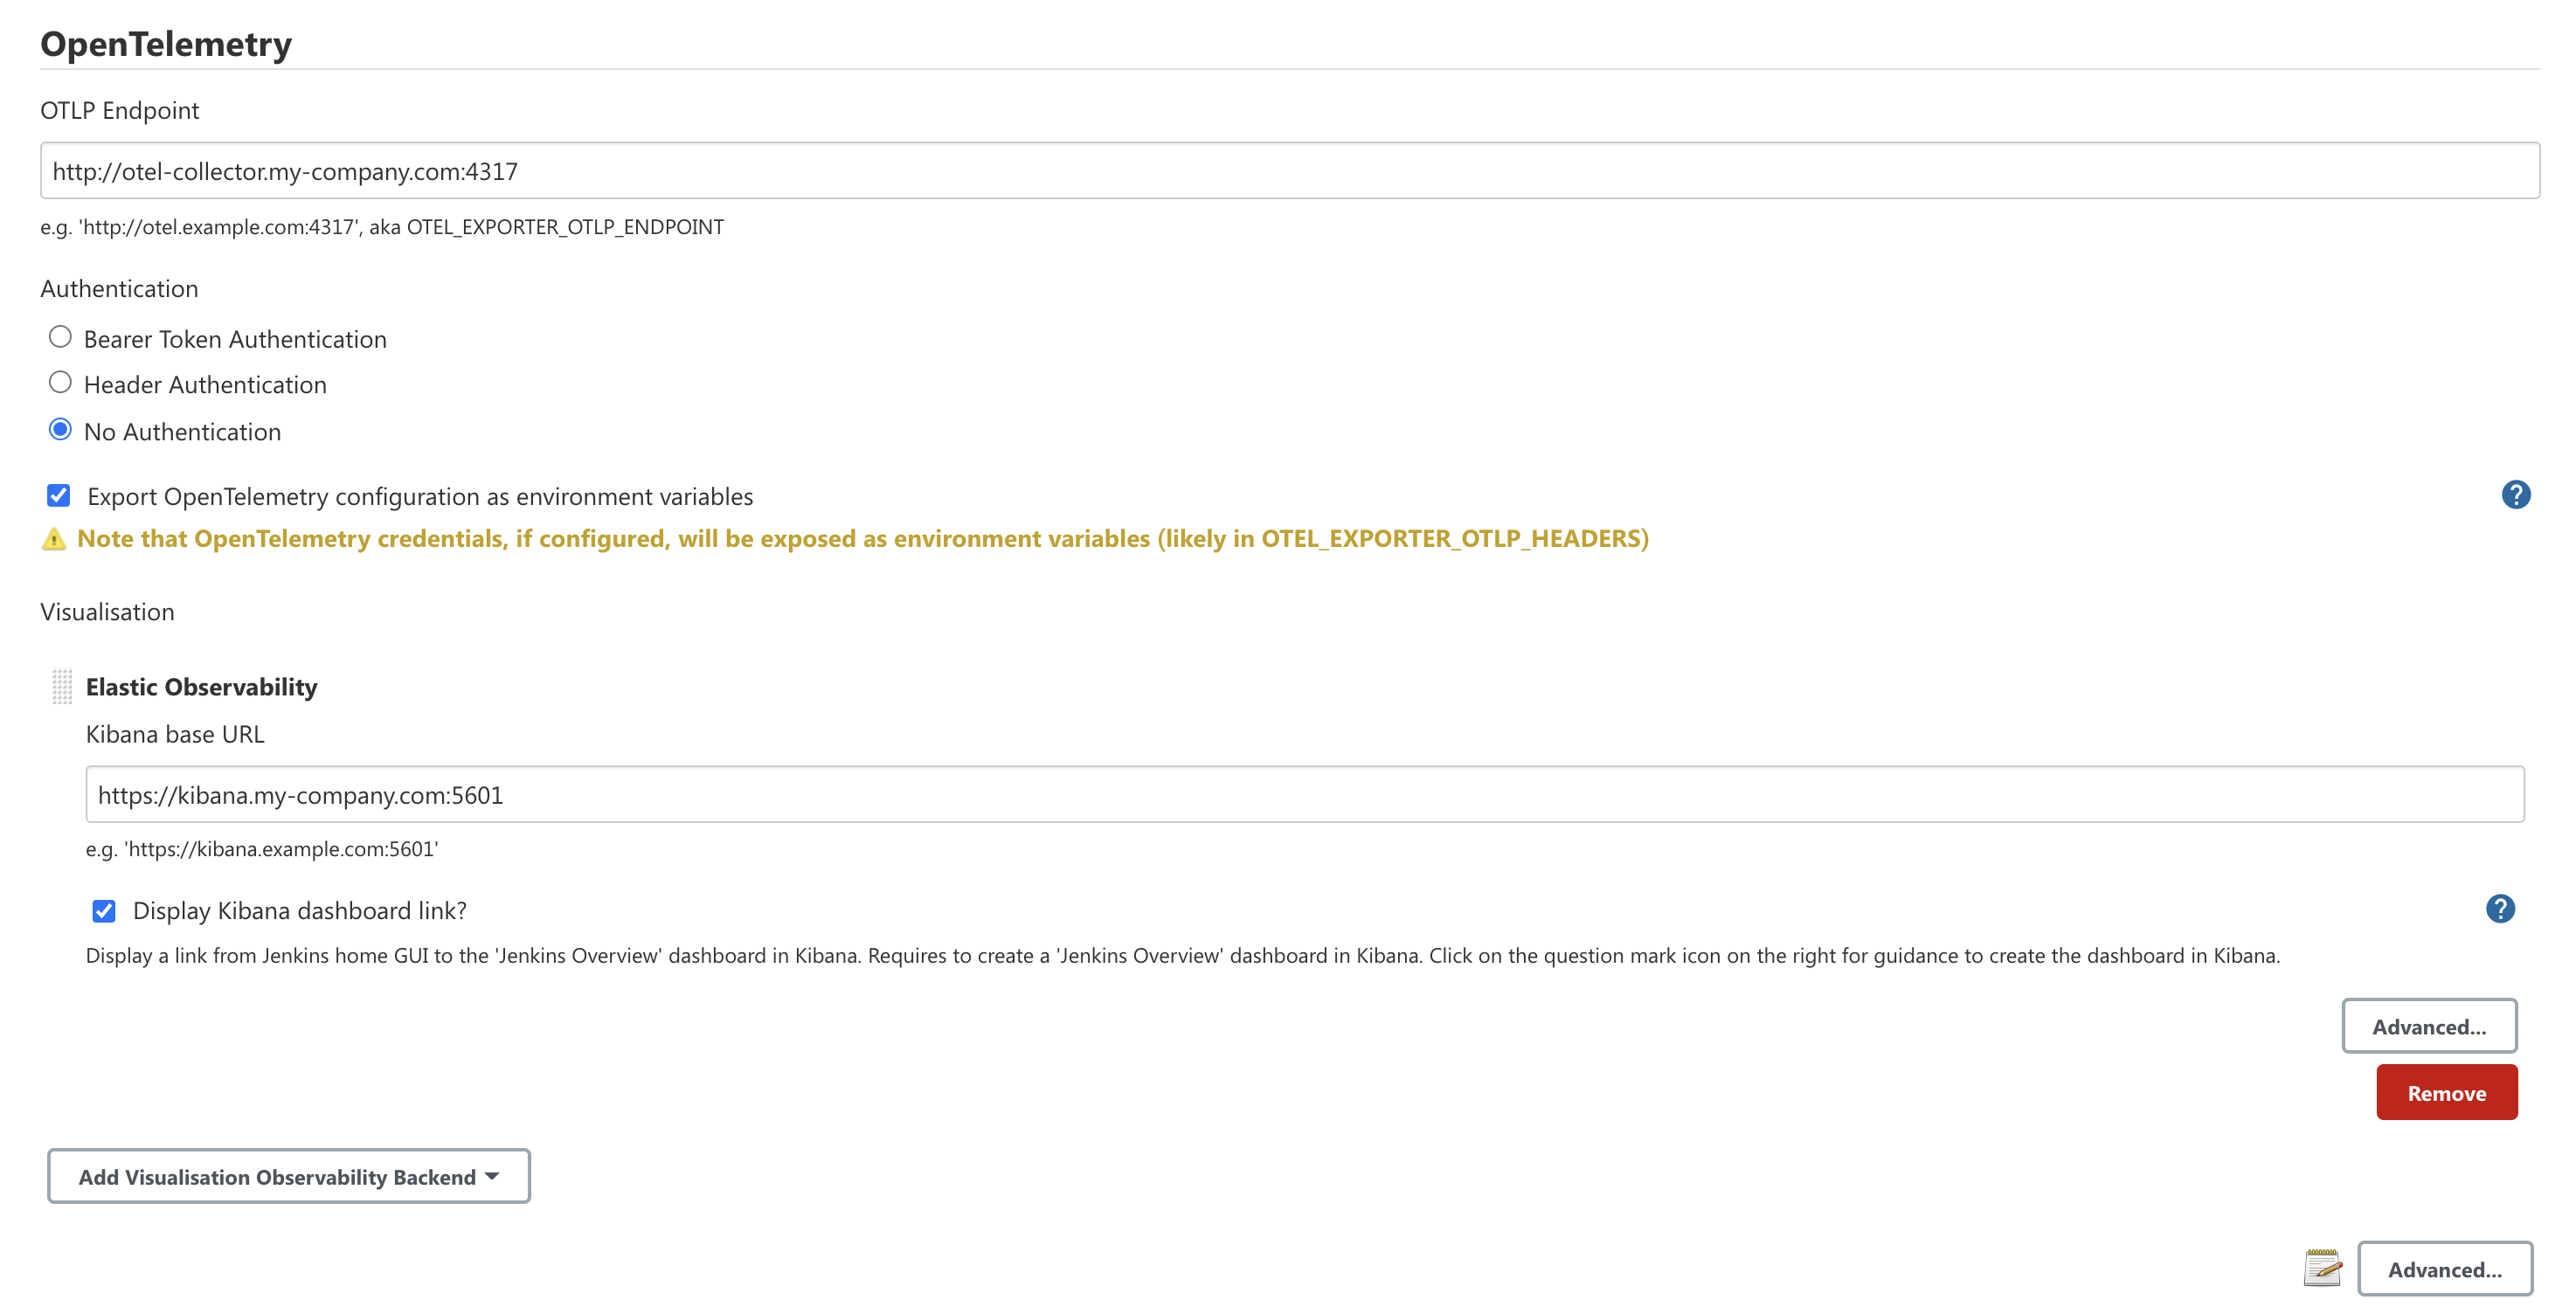
Example Jenkins OpenTelemetry configuration
Setup and Configuration
For details to set up Jenkins with Elastic, Jaeger or Prometheus, to configure the integration including using Jenkins Configuration as Code, see Setup and Configuration.
Troubleshooting and Optimizing Jenkins Jobs and Pipelines Using Tracing on the Builds
For details on how to explore and troubleshoot jobs and pipelines builds as traces, see Traces of Jobs and Pipeline Builds.
Example pipeline execution trace of a SpringBoot app built with Maven going through security checks with Snyk, deployed on a Maven repository and published as a Docker image
Troubleshooting Jenkins Performances Using Tracing on the HTTP Requests of the Jenkins Controller
For details to set up Jenkins with Elastic, Jaeger or Prometheus, to configure the integration including using Jenkins Configuration as Code, see Setup and Configuration.
Jenkins Security
Monitor access to Jenkins to detect anomalous behaviours.
For details, see the security logs, metrics, and trace attributes here.
Storing Jenkins Pipeline Logs in an Observability Backend
For details on how to store Jenkins pipelines build logs in an Observability backend like Elastic, see Storing Jenkins Pipeline Logs in an Observability Backend though OpenTelemetry.
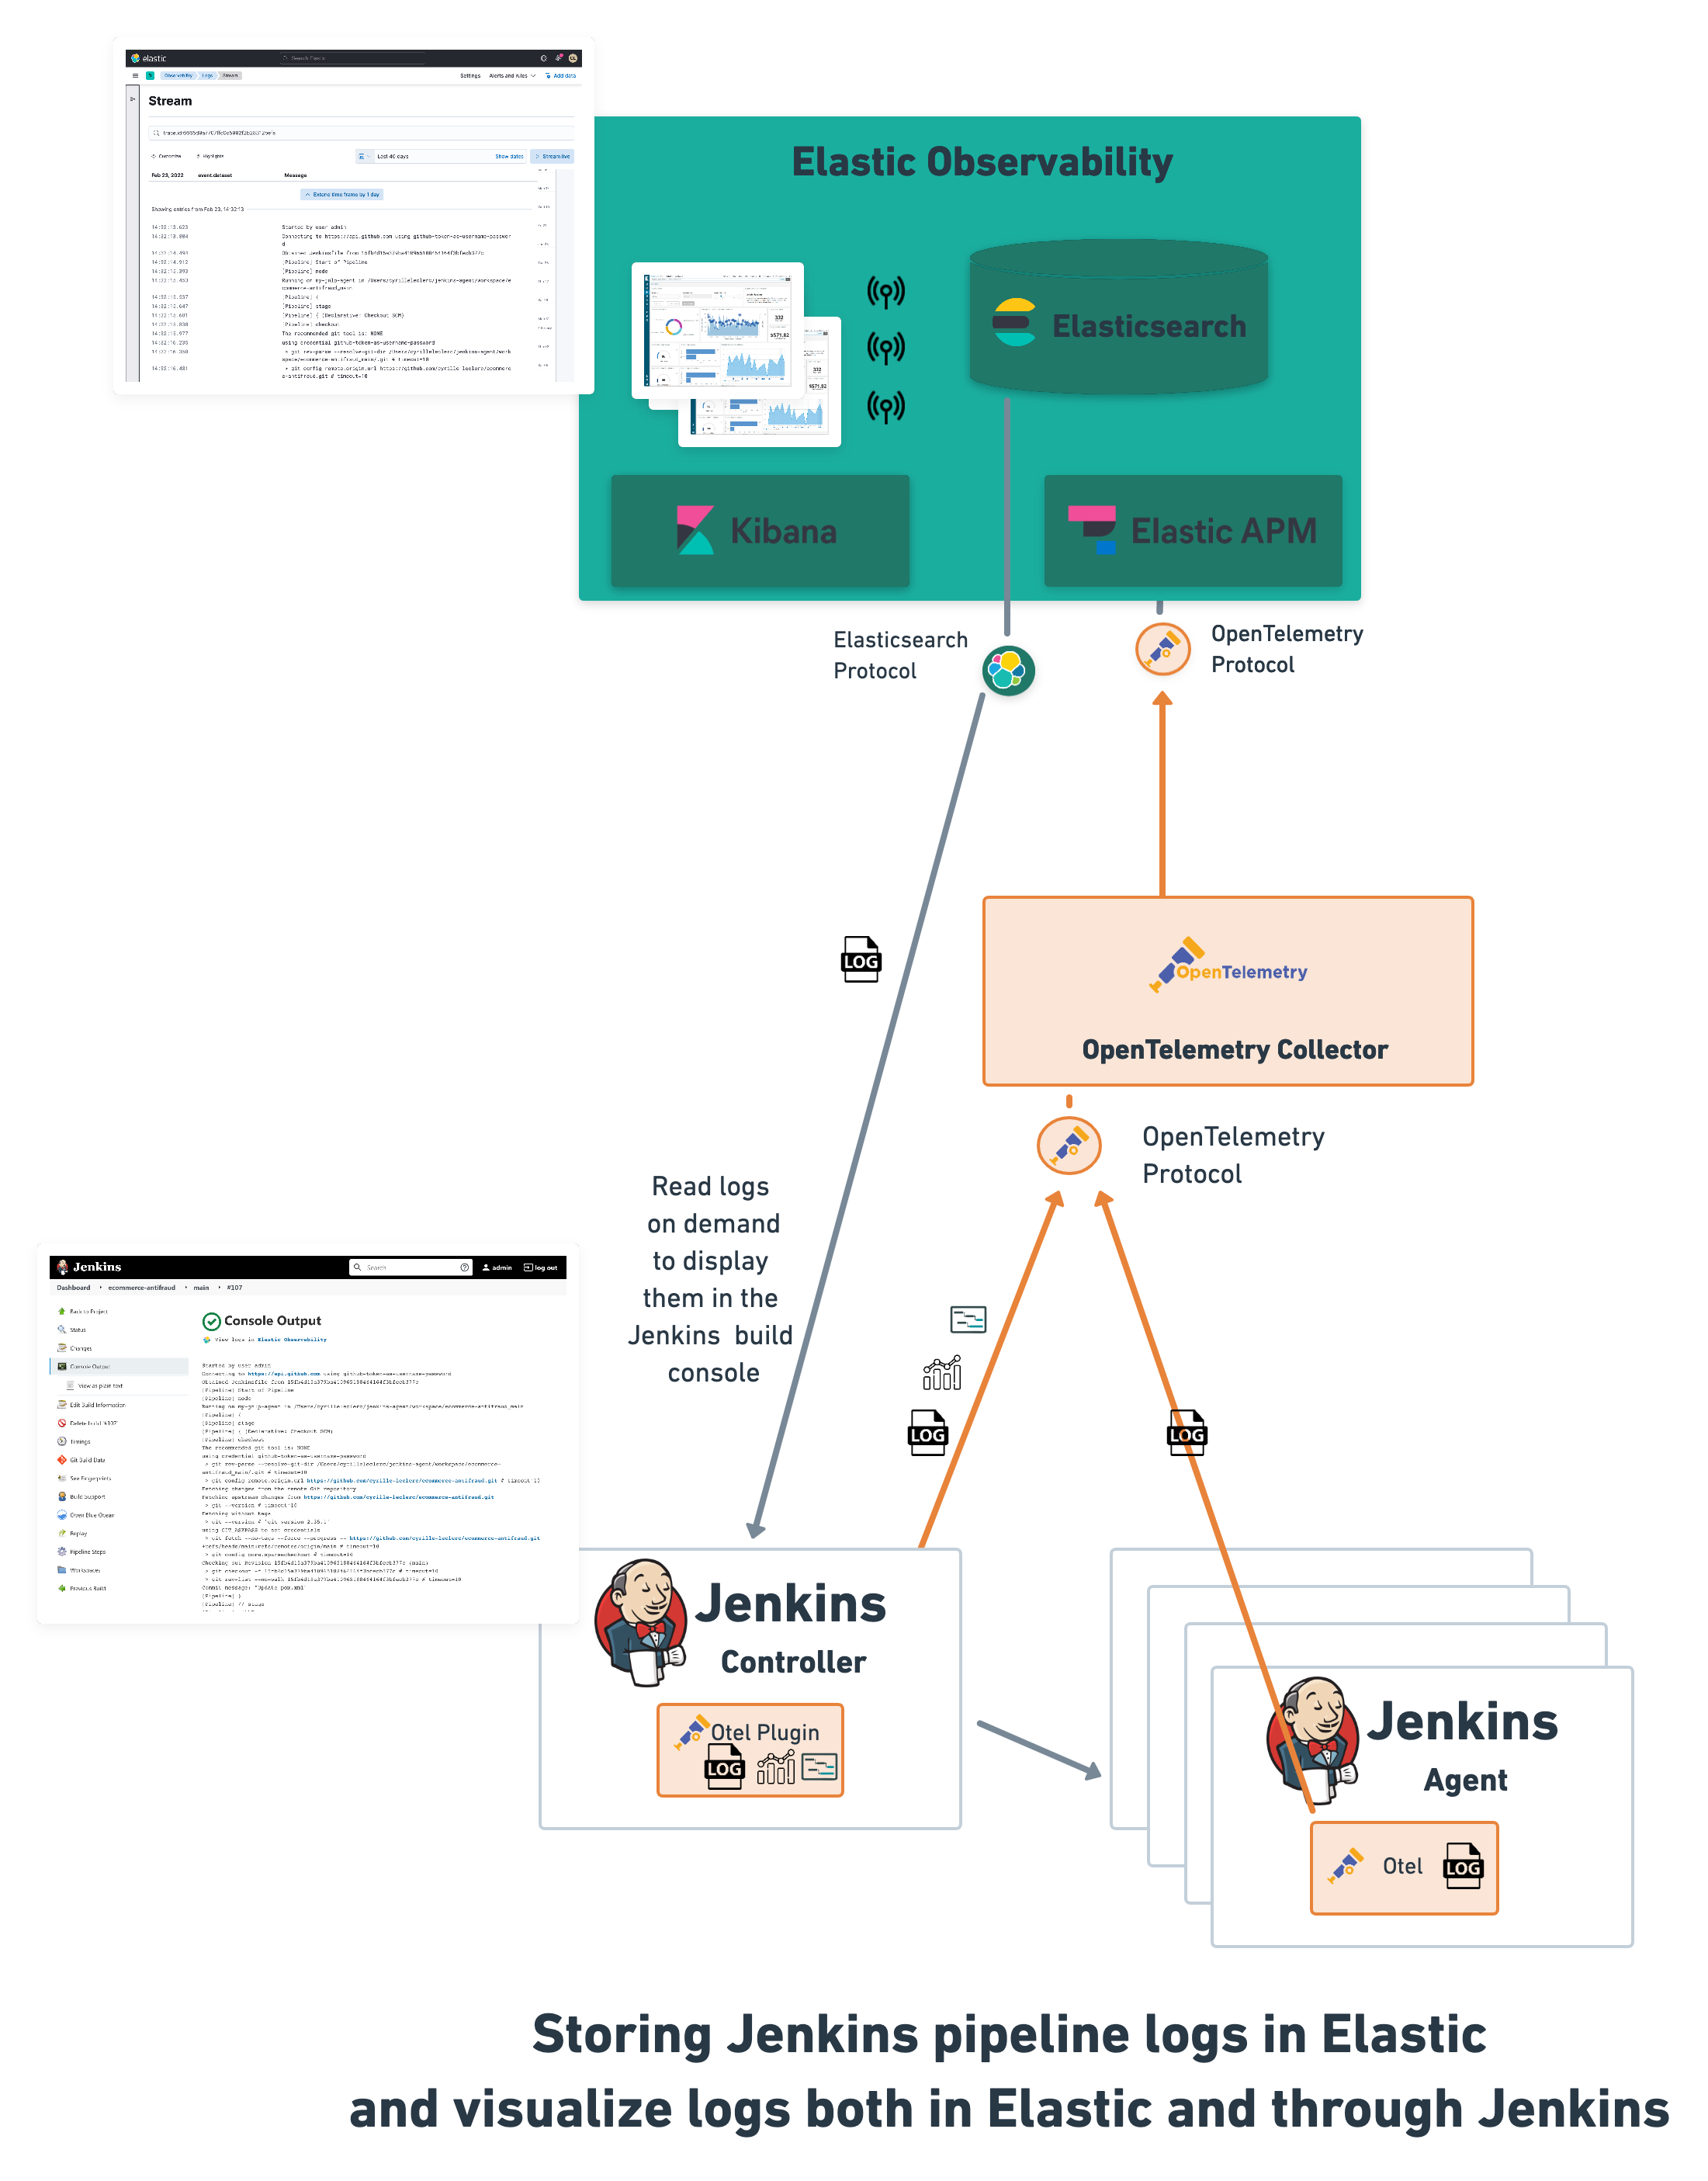
Storing Jenkins pipeline logs in Elasticsearch and visualizing logs both in Kibana and through Jenkins GUI
Other CI/CD Tools supporting OpenTelemetry traces
List of other CI/CD tools that support OpenTelemetry traces and integrate with the Jenkins OpenTelemetryPlugin creating a distributed traces providing end to end visibility.
OpenTelemetry Maven Extension
The OpenTelemetry Maven Extension is a Maven extension to instrument with traces steps of Maven builds, including capturing details of the produced artifacts for traceability.
ℹ️ For seamless and turnkey integration of the trace of the Maven builds that use the OpenTelemetry Maven Extension with the Jenkins trace, consider in the Jenkins configuration to enable "Export OpenTelemetry configuration as environment variables".
OpenTelemetry Ansible Plugin
The OpenTelemetry Ansible Plugin is an Ansible callback to instrument with traces the tasks of Ansible playbooks.
ℹ️ For seamless and turnkey integration of the trace of the Ansible playbooks that use the OpenTelemetry plugin with the Jenkins trace, consider in the Jenkins configuration to enable "Export OpenTelemetry configuration as environment variables".
pytest-otel
The PyTest Otel Plugin is a PyTest plugin to report each PyTest test as a span of a trace.
ℹ️ For seamless and turnkey integration of the trace of the PyTest tests that use the OpenTelemetry plugin with the Jenkins trace, consider in the Jenkins configuration to enable "Export OpenTelemetry configuration as environment variables".
Otel CLI
The otel-cli is a command line wrapper to observe the execution of a shell command as an OpenTelemetry trace.
FAQ
Enrich your pipeline sh, bat, and powershell steps with meaningful explanation thanks to labels
If you use Jenkins pipelines in conjunction with the sh, bat, powershell steps, then it's highly recommended using the label argument to add a meaningful explanation thanks to step labels. Example:
node {
    sh(label: 'Maven verify', script: './mvnw deploy')
}
Using the OpenTelemetry OTLP/HTTP rather than OTLP/GRPC protocol
Navigate to the Jenkins OpenTelemetry Plugin configuration, in the "Advanced" section, add to the "Configuration Properties text area the following:
otel.exporter.otlp.protocol=http/protobuf
Learn More
- You can look at this video tutorial to get started:

- DevOpsWorld 2021 - Embracing Observability in Jenkins with OpenTelemetry
Demos
If you'd like to see this plugin in action with some other integrations then refer to the demos.
Contributing
Refer to our contribution guidelines
LICENSE
Licensed under Apache Software License 2, see LICENSE