pytorch-forecasting
 pytorch-forecasting copied to clipboard
Published
20 hours ago •
 jdb78
jdb78
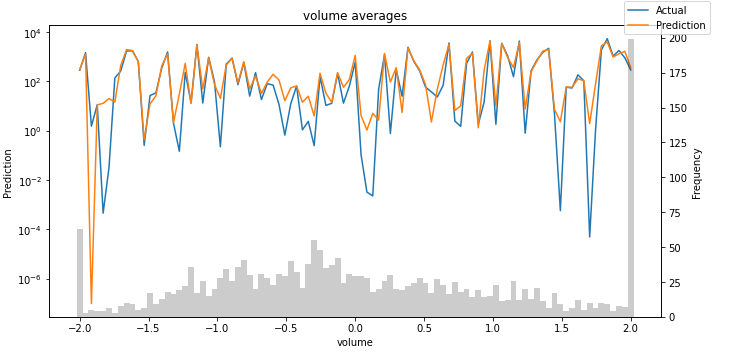
Can you please help in intepreting the output of plot_prediction_actual_by_variable()?
PyTorch-Forecasting version: 0.10.2 Torch: 1.10.1 Python version: 3.8 Operating System: Windows
I woukd need some help to interpret the plot produced by plot_prediction_actual_by_variable()
I take two hereafter as an example (one related to a continuous and one to a categorical variable).

questions:
- are these the forecast of the X variables? if yes, is such forecast produced by the lstm-decoder? (all of it then fed into the self-attention)
- is such plot representing the validation set of the Xs over which I compare with the actual (real) data? (the model should split each X in X_train and X_val )
- how to interpret it? I mean what are the axes (x,y,z) meaning? since it is a prediction, I would expect on the x-axis the time index which in my idea would correspond to the decoder length
- what the average means? in my idea in every batch of training, the model should forecast the Xs before doing the forecast for y. But in every batch the forecast of Xs is probably different so I would guess i will end up with several estimate (equal to the number of batch) of X at t+1..is the average simply the algebraic average of these estimates?
- regarding the categorical variable (months), what is the meaning of prediction? the distance between the blue and the red dot what does it mean? These are variable time-dependent which are known into the future, why the model is predicting those?