hxtelemetry
 hxtelemetry copied to clipboard
Published
20 hours ago •
 jcward
Flame Graphs request per Lars
https://twitter.com/larsiusprime/status/834561936935227396 http://www.brendangregg.com/flamegraphs.html
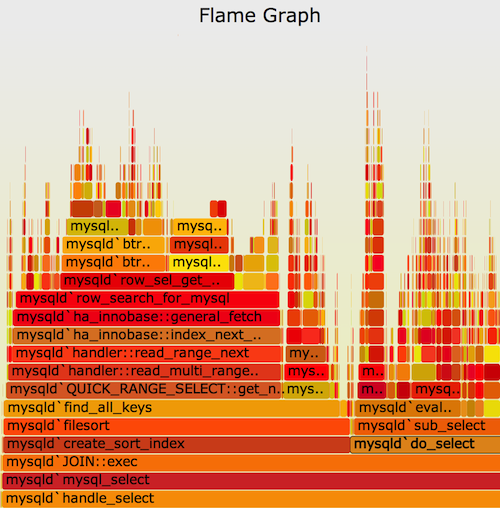
Summary
The x-axis shows the stack profile population, sorted alphabetically (it is not the passage of time), and the y-axis shows stack depth. Each rectangle represents a stack frame. The wider a frame is is, the more often it was present in the stacks. The top edge shows what is on-CPU, and beneath it is its ancestry. The colors are usually not significant, picked randomly to differentiate frames.
Example