openjdk-jfx
 openjdk-jfx copied to clipboard
Resource leak using es2 renderer on X11 and Mesa
There seems to be a resource leak in JavaFX on linux. The issue leads to the X window becoming very unresponsive, the effect is increasing over time.
Used: Linux kernel 4.13.0-39 Mesa 18.0.5 X Server 1.18.4 javafx-sdk-11.0.2 jdk-11.0.2
Start the program like this: java --module-path $PATH_TO_FX --add-modules=javafx.controls HelloProgressIndicator
Make sure that ES2 pipeline is used for rendering, the issue only occurs there.
Use the tool xrestop to monitor the resources of the X server
A process without PID
Using -Dquantum.singlethreaded=true makes the issue disappear.
The following code can be used:
import javafx.application.Application;
import javafx.scene.Scene;
import javafx.scene.control.ProgressIndicator;
import javafx.stage.Stage;

public class HelloProgressIndicator extends Application {

    ProgressIndicator progress = new ProgressIndicator(-1);

    @Override
    public void start(Stage primaryStage) throws Exception {
        primaryStage.setScene(new Scene(progress, 100, 100));
        progress.setVisible(true);
        primaryStage.show();
    }

    public static void main(String[] args) {
        launch(args);
    }

}
I'm experiencing the same bug. The issue seems to be that insane amounts of VRAM are allocated and then swapped out to the RAM which in turn fills that up until the system becomes completely unresponsive.
This is reproducible on my system by running any JavaFX App, and it leaks much faster when there are animated components, e.g. above example, or a program with a Label that has a Transition (below), etc.
Running the program normally:
GALLIUM_HUD=fps,requested-VRAM,VRAM-usage java --module-path /home/valentin/Quellcode/Javafx-SDK/lib/ --add-modules javafx.base,javafx.controls,javafx.graphics,javafx.fxml,javafx.media -jar MyFXApp.jar
Result:
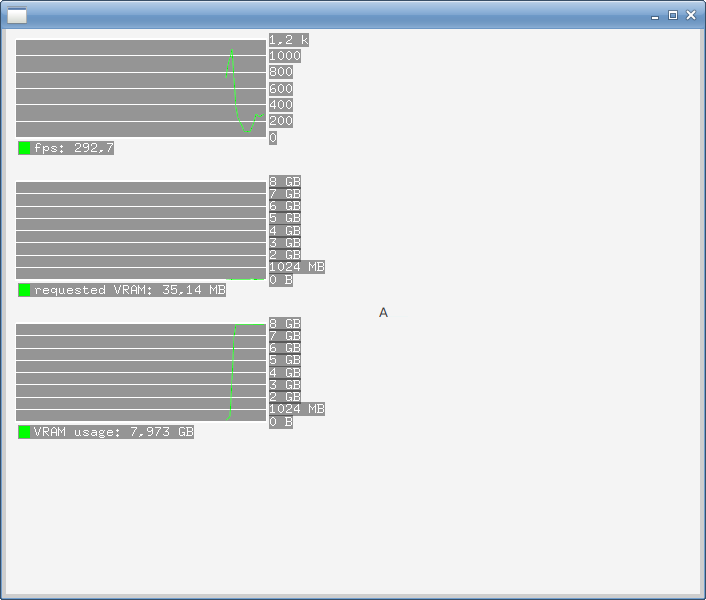 System quickly runs out of RAM (+swap) after that.
Running it with the -Dquantum.singlethreaded=true flag:
GALLIUM_HUD=fps,requested-VRAM,VRAM-usage java -Dquantum.singlethreaded=true --module-path /home/valentin/Quellcode/Javafx-SDK/lib/ --add-modules javafx.base,javafx.controls,javafx.graphics,javafx.fxml,javafx.media -jar MyFXApp.jar
Result:
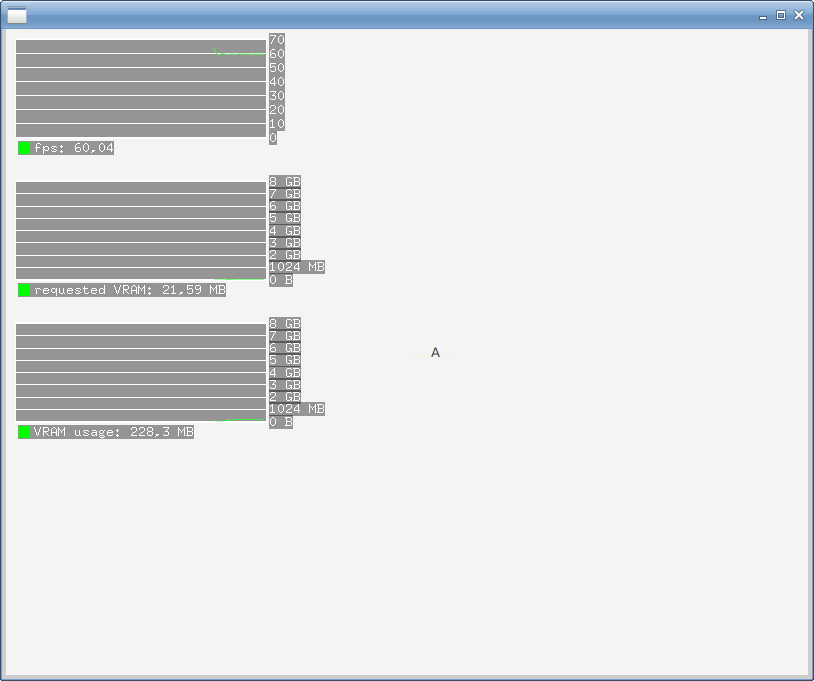 Everything is fine.
Perhaps also interesting:
System Info: OS: Ubuntu 18.04.4 LTS JDK Version: openjdk version "11.0.7" 2020-04-14 JavaFX: 14.0.1 Glxinfo:
Vendor: X.Org (0x1002)
Device: Radeon RX 580 Series (POLARIS10, DRM 3.33.0, 5.3.0-46-generic, LLVM 9.0.0) (0x67df)
Version: 19.2.8
Accelerated: yes
Video memory: 8192MB
Unified memory: no
Preferred profile: core (0x1)
Max core profile version: 4.5
Max compat profile version: 4.5
Max GLES1 profile version: 1.1
Max GLES[23] profile version: 3.2