Jan Käberich
Jan Käberich
With 7123984, the smith chart (and the newly introduced polar chart) has a "visible frequency override setting": 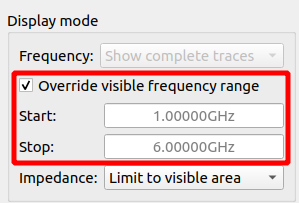
I do not have a 4k screen and using a font size of 30 with my monitor only allows me to partially reproduce the problem:  The X axis tick...
Sure, you need to look in Software/PC_Application/LibreVNA-GUI/Traces/tracexyplot.cpp Line 424 and 426 for the Y-axis tick labels, line 630-631 for the X-axis tick labels. This all assumes you are using the...
> Everything is normal, only there are frequency verticals, under which there are no frequency marks. Tick labels on the X axis are skipped if they would not fit (when...
> Is it possible to reduce the distance between Magnitude and Phase and the graph? You can reduce the font size, it also influences the size reserved for the Y...
Interesting, I can replicate that when I download the compiled version from Github but when I compile on my machine and execute that, there is no crash. That will make...
Please check the result from this run: https://github.com/jankae/LibreVNA/actions/runs/3246096610 I just removed some warnings in the compiler run and didn't actually expect to fix anything by that but this version works...
Hi Patrick, I can't be sure but my best guess is that you don't have any calibration standards defined. The selection in the "Calkit Standard" column must not be empty:...
> Yes it works now. Awesome :) > Sorry for forgetting creating CAL standard before. No need to be sorry, thank you for discovering the bugs. I'll look into the...
I'll go ahead and close this as the original issue seems to be solved. Feel free to open a new issue if you find any other problems or bugs :)