jaeger-ui
 jaeger-ui copied to clipboard
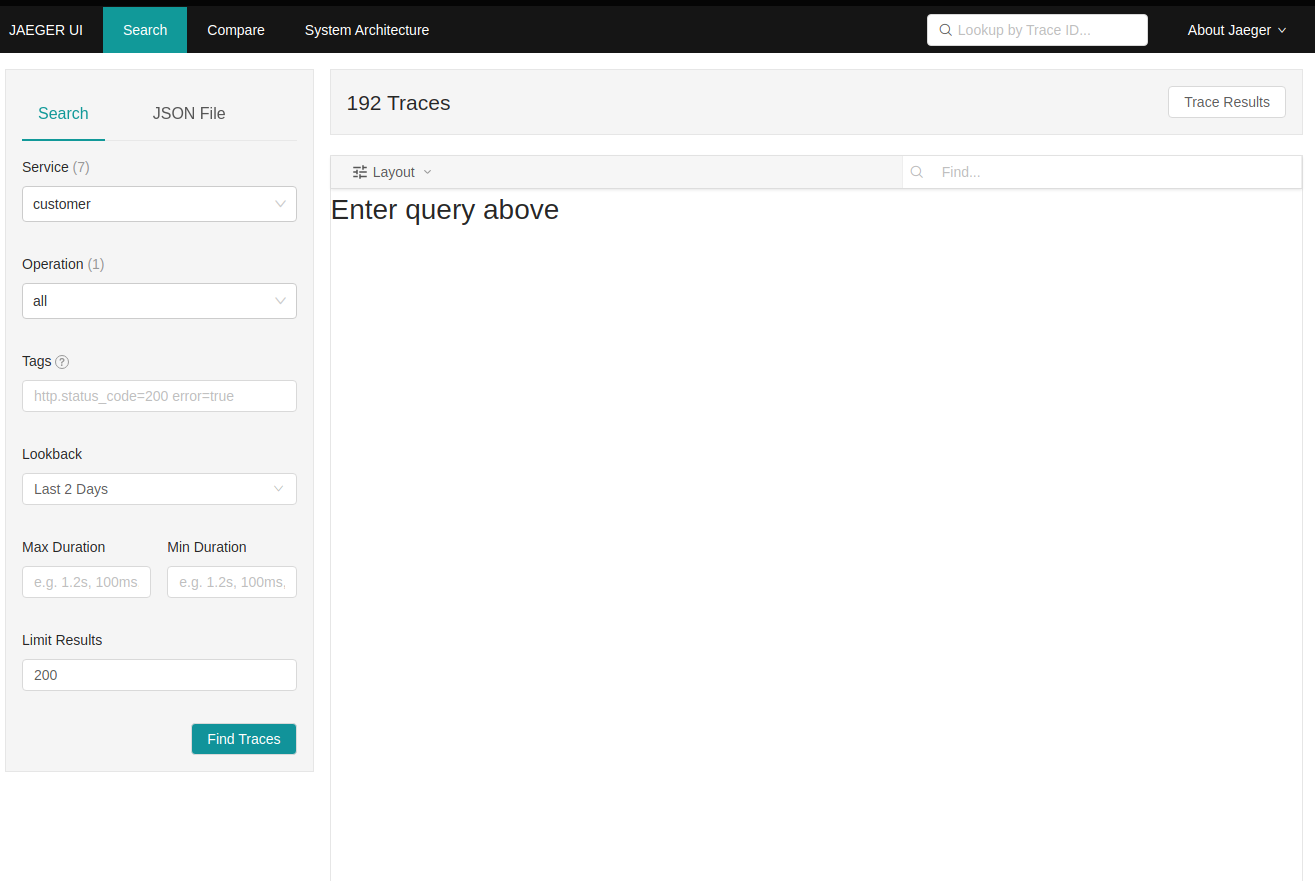
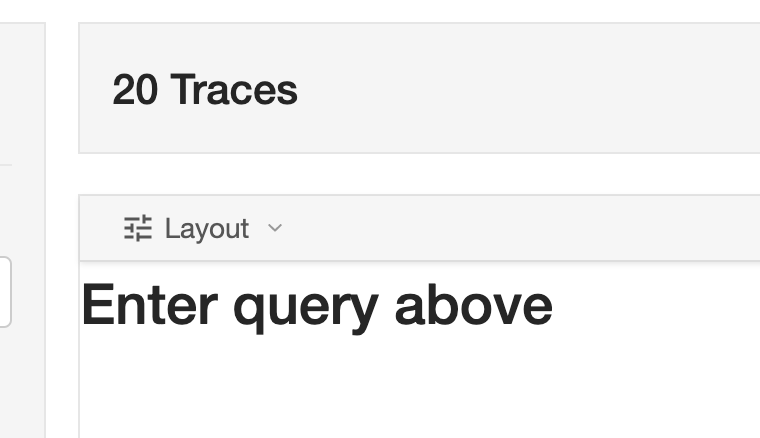
Deep dependency graph only shows "Enter query above"
Describe the bug
When I view the deep dependency graph for a trace, the UI only shows the message Enter query above.
To Reproduce Steps to reproduce the behavior:
- From the trace overview, click the Deep Dependency Graph button.
Expected behavior Seeing a graph.
Screenshots

Version (please complete the following information):
- OS: any
- Jaeger version: UI is 1.14.0
- Deployment: ECS
What troubleshooting steps did you try? none
Additional context nothing
Just updated to latest jaeger all-in-one with jaeger-ui 1.15.0 and now the message went away.
Actually, it's still happening. I don't understand what the difference is between when I see the message and when it shows the expected UI.
It seems like the results doesn't have enough information to derive the graph. Is it possible to share the tracing results? IIRC there is a way to anonymize the information. I'm interesting in the structure of the traces.
@rubenvp8510 What would be a good way of sharing those? Just copy the JSON from the API responses?
I'm sure I have a couple that have no confidential information
Hey! Same issue here! Thank you in advance for your attention
I used the HotROD app to generate the traces
I'm attaching 2 json files with the responses of each one of the 2 requests made by the JaegerUI one with limit 50, other with limit 200
Below you can find the cURL representation of the request, copied from Chrome DevTools
curl 'http://localhost/api/traces?end=1628680676372000&limit=200&lookback=2d&maxDuration=500s&minDuration=1ms&service=frontend&start=1628507876372000' \
  -H 'Connection: keep-alive' \
  -H 'User-Agent: Mozilla/5.0 (X11; Linux x86_64) AppleWebKit/537.36 (KHTML, like Gecko) Chrome/92.0.4515.107 Safari/537.36' \
  -H 'Accept: */*' \
  -H 'Referer: http://localhost/search?end=1628680639351000&limit=50&lookback=2d&maxDuration&minDuration&service=frontend&start=1628507839351000' \
  -H 'Accept-Language: en-US,en;q=0.9,pt-PT;q=0.8,pt;q=0.7' \
  --compressed \
  --insecure
I got the same issue on the latest version.
I also get this error:
There was an error querying for traces:
HTTP Error: parameter 'service' is required
Status	400
Status text	Bad Request
URL	/api/traces
Query	view=ddg
Response body	{
  "data": null,
  "total": 0,
  "limit": 0,
  "offset": 0,
  "errors": [
    {
      "code": 400,
      "msg": "parameter 'service' is required"
    }
  ]
}
I got the same issue on the version:
Jaeger v1.26.0 Commit 8427e01 Build 2021-09-06T18:29:49Z Jaeger UI v1.16.0
In my case, it happens to me when I select a particular service, and after that it never works again for me. The only way to fix for me, is open a private session, and select a different service. The strange thing is I tried to make the same graph with the same traces and I had no problems.
Same here. Strange behaviour - sometimes it works, but in most cases I get Enter query above until I manually add &view=ddg to url.
Also got 400 "parameter 'service' is required" few times.
Jaeger UI v1.14.0