Combined (border+image) Program Node Rendering Issue
Combined (border+image) Program Node Rendering Issue
Description
When using a combined program (node-image and node-border) for rendering nodes, overlapping nodes appear messy. The nodes' borders are rendered separately and on a different layer from their images, resulting in a 'transparent background effect' or incorrect clipping areas. This issue is critical for large graphs, as graphology lacks collision layout, leading to massive node overlap.
Details
- Sigma.js version: 3.0.0-beta.18
- Graphology version: 0.25.4
- Operating system: Windows 11
- Web browser: Google Chrome Version 124.0.6367.202 (Official Build) (64-bit)
Steps to Reproduce
- Visit the live example: Codesandbox Example
- Observe the rendering of overlapping nodes.
Expected Behavior
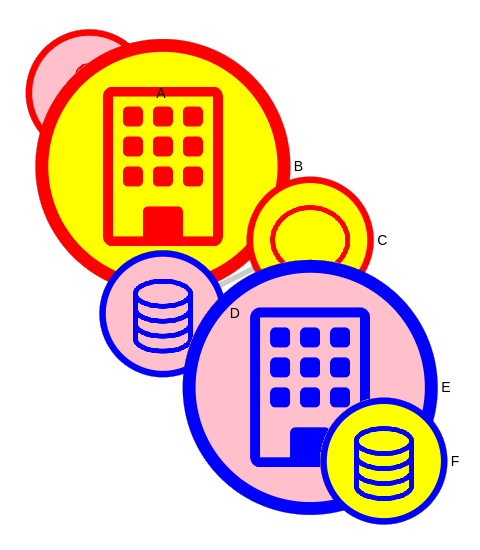
When nodes overlap, their borders should be clipped accordingly, similar to the node 'B' in the reference image below:
Actual Behavior
Nodes' borders are displayed regardless of the nodes' z-position, leading to visual artifacts and a cluttered appearance:
Additional Information
This issue becomes more noticeable and problematic for large graphs due to the lack of collision layout in Graphology, causing significant node overlap.
@oda79 Thanks for that report!
I totally get this issue, and that's bad, and I have no idea how to solve it yet. Maybe something with z indexing, I'll try as soon as I can.
About collision layout in Graphology though, you can use graphology-layout-noverlap. It was not working properly with sigma.js before because we reinterpolated node sizes before, but since v3 you can use zoomToSizeRatioFunction and itemSizesReference (like in this example) to render sizes exactly as they are in the data, which allows graphology-layout-noverlap to work properly.
I hope this helps, until I find how to solve the initial problem.
Just to keep you updated, I started digging, and enabling the depth buffer might be the solution, though it kinda collides with alpha blending at the moment. I'll keep trying when I have some time.
 (source)
Thank you for the update! And also for the hint about using zoomToSizeRatioFunction and itemSizesReference, these options made a lot of difference.
In general, graphology layouts are a bit weird in comparison to d3-force, and they can not be combined.
Regarding the issue, to overcome it I made a new node-image-border program/package, which is a combination of node-image and node-border. It draws a circle node with one outer border and image/colored pictorgam/color inside. In addition, I added an alpha attribute to a node (0..1). All settings are similar to these of the parent programs. So, it looks like the following.
It is definitely not the fix. But if is worth being added to the packages, I guess it needs a new issue for a further PR.
Thanks for your efforts!
Update:
I found a way to fix the issue using the discard; GLSL instruction (source). Unfortunately, it supposedly has a bad impact on performances... So I keep looking, but in the worst case we could imagine having those discard; only used in the shaders when the zIndex setting is set, for instance (using GLSL macros).
FYI I've been working on a fix these last days, and it starts working: https://github.com/jacomyal/sigma.js/tree/fix-1427
The main issue that remains is that using discard; means that we cannot draw behind anti-aliased pixels, and it is visible sometimes:
After some more digging, it appears that one solution to solve that glitch would be to implement some "order independent transparency" technique, such as this one.
We've just run across this very issue during user feedback testing. Users zoom out and see images overlayed within the node layering on top of the other nodes. We use images inside the node to visualize what the node represents, especially when a user zooms out and the node label disappears.
As an alternative/workaround, is clustering of nodes supported? For example.. Two or more nodes would cluster/group together to form a node that says "+5" more nodes when zooming out.
Also, we're interested to see multi-node selection and the ability to collapse/expand sections of the graph.
@oda79 Can you share some basic example in which you combine the images with borders? The original example does not seem to be available anymore.
I try to implement such solution in my work, I used the custom node program like the one here: https://github.com/jacomyal/sigma.js/blob/main/packages/storybook/stories/3-additional-packages/node-border/with-images.ts and it works perfectly:
const NodeBorderCustomProgram = createNodeBorderProgram({
    borders: [
        { size: { value: 0.2 }, color: { attribute: "pictoColor" } },
        { size: { fill: true }, color: { attribute: "color" } },
    ],
});
const NodePictogramCustomProgram = createNodeImageProgram({
    objectFit : 'contain',
    padding: 0.3,
    size: { mode: "force", value: 256 },
    drawingMode: 'color',
    colorAttribute: "imageColor",
  });

const NodeProgram = createNodeCompoundProgram([NodeBorderCustomProgram, NodePictogramCustomProgram]);
However I need to keep the original image without recoloring it. I removed the colorAttribute and it works partially: the images are loaded properly but the border is really thin and I can't change its size. I am clearly missing something here, so I would be glad for any tips.
I use: Sigma.js version: 3.0.1 Graphology version: 0.25.4
@bmklucznik sorry for the late reply. Here is my sigma settings (React) for image+border nodes. Hope this will help.
function useGraphSettings() {
  return useMemo<Partial<Settings>>(() => {
    const NodeBorderCustomProgram = createNodeBorderProgram({
      borders: [
        {
          size: { value: 0.2, mode: "relative" },
          color: { attribute: "borderColor" },
        },
      ],
    });

    const NodeImageCustomProgram = createNodeImageProgram({
      padding: 0,
      size: { mode: "force", value: 256 },
      drawingMode: "background",
      keepWithinCircle: true,
      correctCentering: true,
    });

    const NodeProgram = createNodeCompoundProgram([
      NodeImageCustomProgram,
      NodeBorderCustomProgram,
    ]);
    return {
      ...(sigmaDefaultSettings as Partial<Settings>),
      ...{
        nodeProgramClasses: {
          image: NodeProgram,
        },
        edgeProgramClasses: {
          straight: EdgeArrowProgram,
          curved: EdgeCurvedArrowProgram,
        },
      },
    };
  }, []);
}
@rahst12 I think clustering (grouping nodes with the same relations) is more of a graph manipulation (graphology) task than something that should be handled by graph visualization (sigma). I implemented clustering myself, and it was actually pretty straightforward.
As for overlapping nodes, I got rid of the weird built-in ForceAtlas2 and hooked up d3-force instead. Now the graph feels much more dynamic, nodes don’t overlap anymore thanks to the collision force and the layout stops on its own