panel-geodashboard-twitter
 panel-geodashboard-twitter copied to clipboard
A simple Panel-based dashboard visualizing geotagged tweets with hvplot and Datashader.
:bird: Twitter dashboard
![]()
A Panel-based dashboard visualizing geotagged tweets with hvplot, Datashader and Echarts.
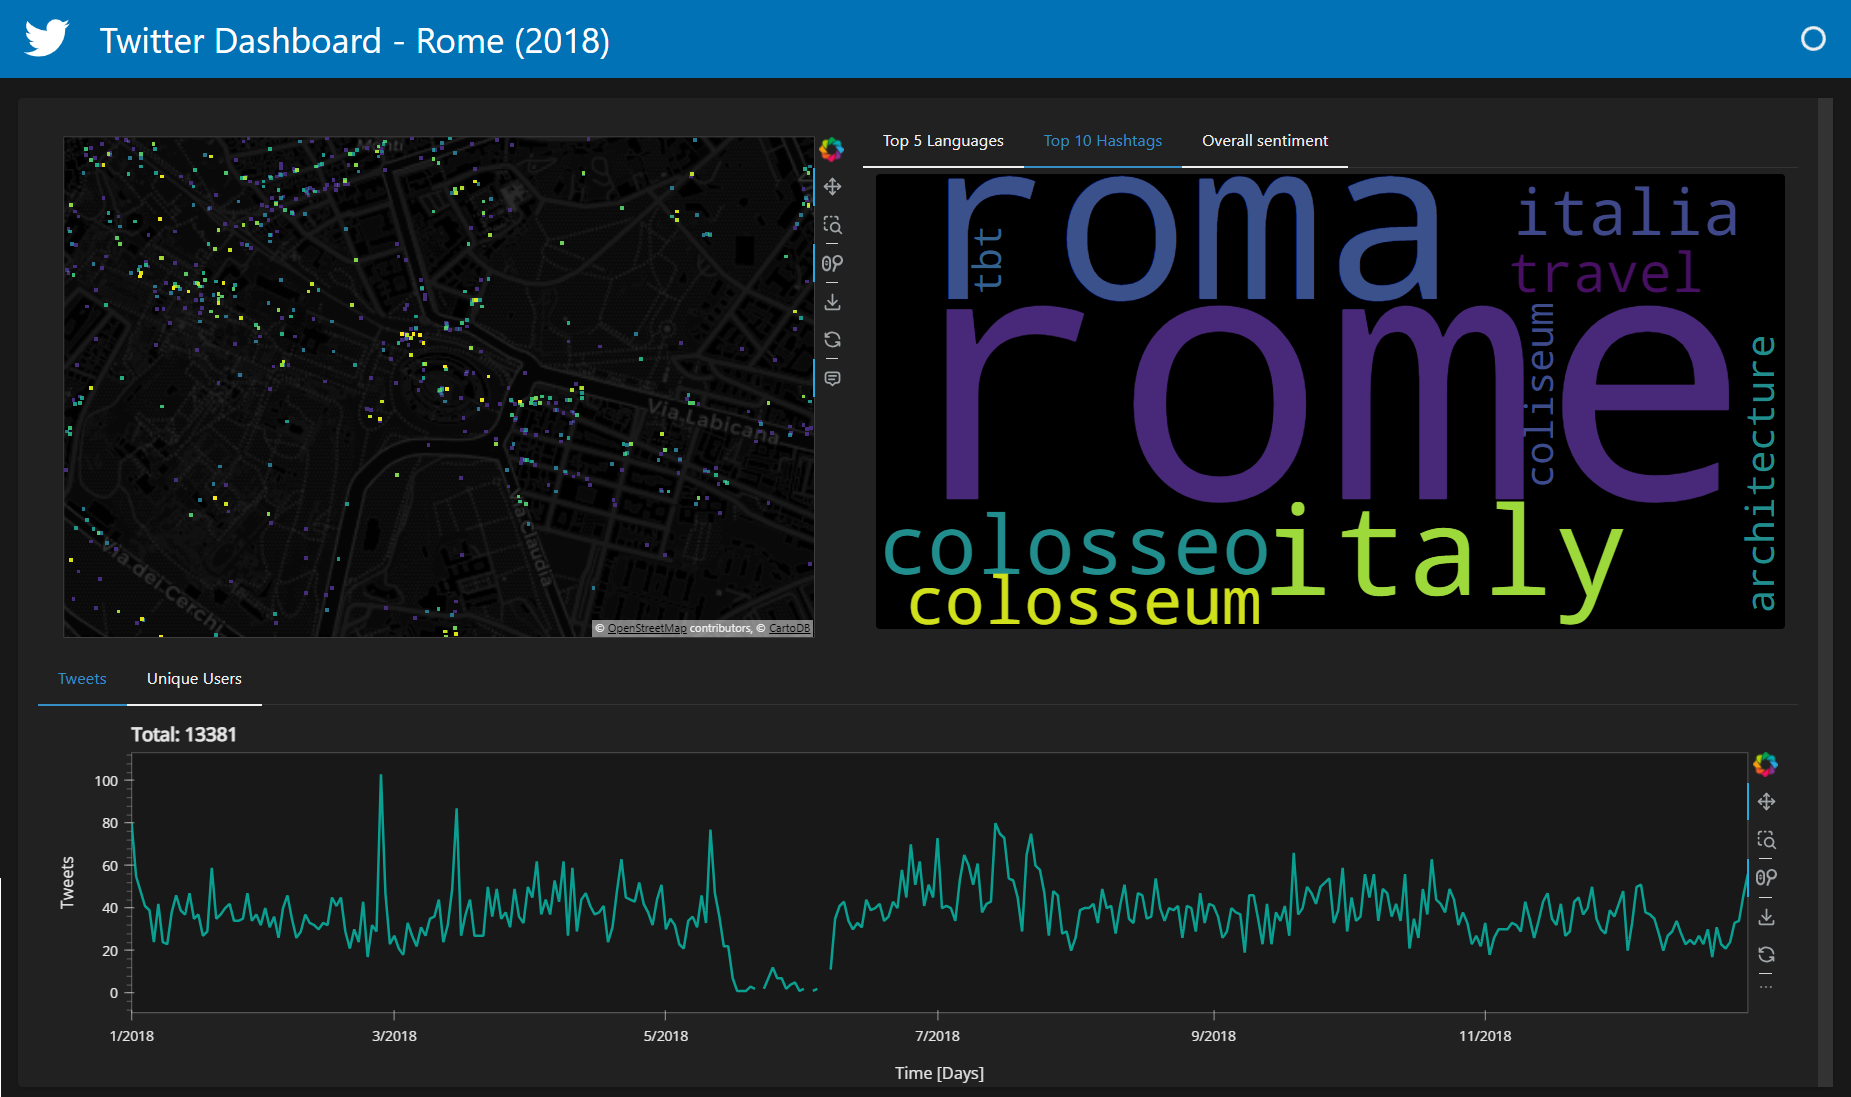
The dashboard includes:
-
An heatmap showing the number of tweets;
-
A bar plot showing the 5 most common languages within the current map extent;
-
A wordcloud SVG showing the 10 most popular hashtags within the current map extent;
-
A pie chart showing the overall sentiment (positive/negative) within the current map extent;
-
Two line charts showing the number of tweets and unique users on a daily basis within the current map extent;
Deployed on
Hugging Face: https://huggingface.co/spaces/ivn888/Twitter-dashboard
Twitter data (link)
This dataset contains over 200k geotagged tweets in parquet format:
-
Coverage: Historic Centre of Rome, Italy;
-
Year: 2018;
-
Language: Multi;
-
Source: This dataset was scraped by myself with snscrape;
| Column | Description |
|---|---|
| tweet_date (index) | Tweet creation date |
| user_id | Unique identifier of the tweet author |
| user_location | User location information |
| tweet_id | Unique identifier of the tweet |
| tweet_text | Tweet content |
| tweet_hashtags | Comma separated list of the tweet hashtags |
| tweet_lang | Tweet language |
| tweet_sentiment | Sentiment Analysis (Multilingual model) |
| tweet_topic | Topic Classification (English, single-label model) |
| x | x-coordinate of the tweet |
| y | y-coordinate of the tweet |
How to run this app on your local system
- Git clone this repository:
git clone [email protected]:ivandorte/panel-geodashboard-twitter.git
cd panel-geodashboard-twitter
- Install the required Python packages:
python -m pip install -r requirements.txt
- Run the app
panel serve app.py --show
The dashboard will be available in your default web browser!!!
References
Authors
- Ivan D'Ortenzio
![]()
![]()