vscode-dvc
 vscode-dvc copied to clipboard
Accomodate flexible plots
DVC are about to introduce flexible plots via the plots diff command.
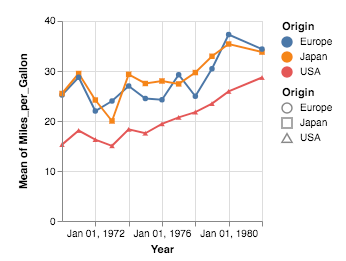
Example of a flexible plot:
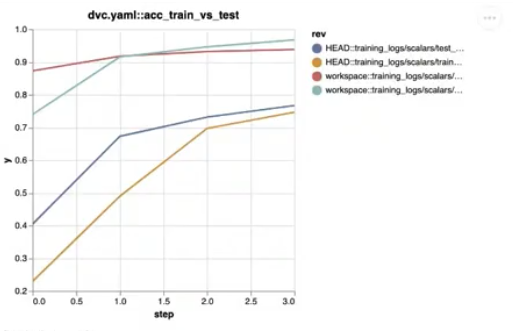
In this particular example, we can see that there are multiple lines for the HEAD commit and multiple lines for the workspace.
Current VS Code UI:
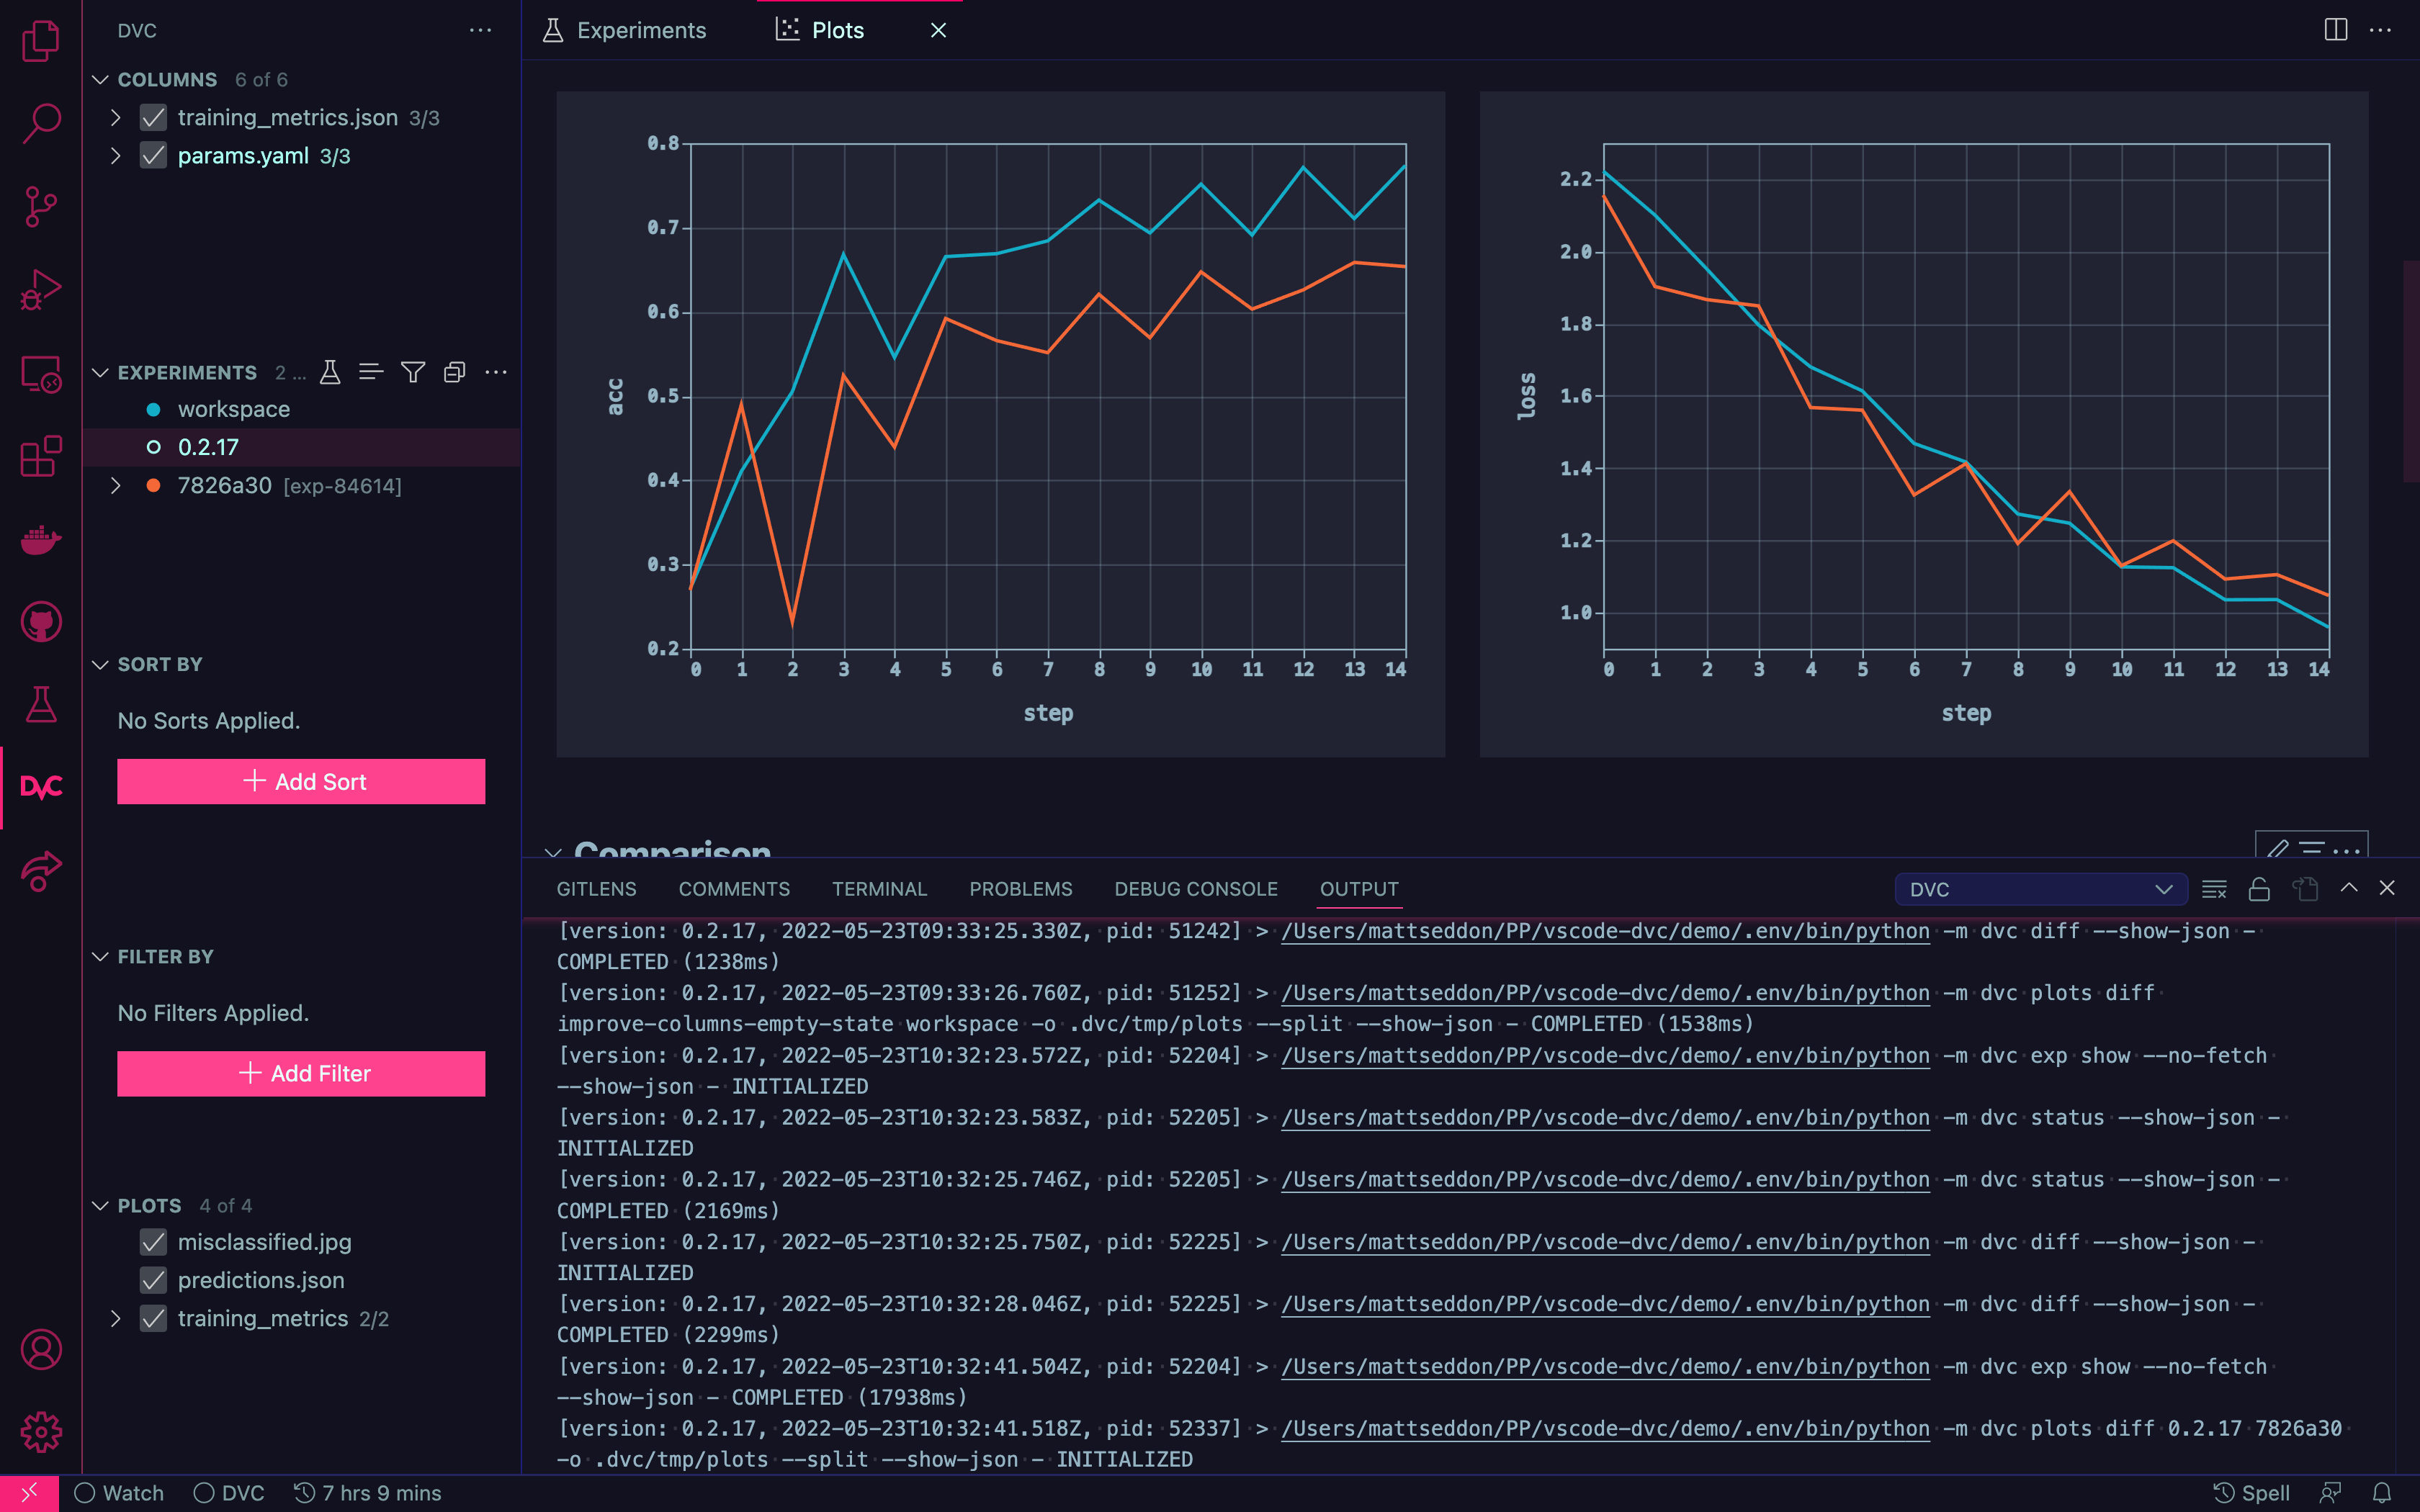
When comparing the two it should become clear that there is an issue. In VS Code we have a single line per experiment. If we had a flexible plot and exp-84614 (from screenshot) needed to show train vs test (and a line for each) then what would we do? We currently do not show a legend as we want to "globally link" each color back to an individual experiment. We cannot simply show two red lines. We could potentially show one as dashed and the other solid but we should still need to add an indicator somewhere in the view to detail which is which. It also would not be long before we run out of line types.
In order to accommodate the new plots data we need to do a few things (with different priorities):
- [x] Make sure no breaking changes - p1
- [ ] Consume new data - p1
- [ ] Update the design to be able to accommodate the new visuals - p2
@mattseddon thanks for creating the ticket 🙏
I would go with a different type of line. Btw, @dberenbaum @pared how does DVC render assign colors in this case? It feels it can also benefit greatly if we do different line types of the same color per revision.
@pared are there docs for the flexible plots already?
Looking at example output data now.
Here are some thoughts (cc @pared)
            "revisions": [
                "HEAD::training_logs/scalars/test_accuracy.tsv::test_accuracy",
                "HEAD::training_logs/scalars/train_accuracy.tsv::train_accuracy",
                "HEAD::training_logs/scalars/train_loss.tsv::train_loss",
                "workspace::training_logs/scalars/test_accuracy.tsv::test_accuracy",
                "workspace::training_logs/scalars/train_accuracy.tsv::train_accuracy",
                "workspace::training_logs/scalars/train_loss.tsv::train_loss"
            ]
:point_up: I know that we had issues when we changed this part of the API before but I think migrating to a list of dicts might be a good idea. E.g
{ rev: string, filename: string, subplot:string, id: string }[]
Example of a single dict (subplot needs a better name):
{
    "rev": "HEAD",
    "filename": "training_logs/scalars/test_accuracy.tsv",
    "subplot": "test_accuracy",
    "id": "HEAD::training_logs/scalars/test_accuracy.tsv::test_accuracy"
}
The only reason I say that is because using the current "id/string only" format means all of the consumers will blow up if the way the id is constructed changes.
That would also mean that we could potentially strip the filename from the datapoints:
            "datapoints": {
                "workspace::training_logs/scalars/test_accuracy.tsv::test_accuracy": [
                    {
                        "timestamp": "1653356122273",
                        "step": "0",
                        "test_accuracy": "0.9281449044585988",
                        "dvc_inferred_y_value": "0.9281449044585988",
                        // "filename": "training_logs/scalars/test_accuracy.tsv"
                    },
[Q] In the above what is the difference between "test_accuracy" & "dvc_inferred_y_value"?
If we have:
"y": {
    "field": "dvc_inferred_y_value",
    "type": "quantitative",
    "title": "y",
    "scale": { "zero": false }
}
do we need "test_accuracy"?
LMK what you think. These are just some initial thoughts.
Notes for self:
We will need to use the title of the plots e.g dvc.yaml::acc_train_vs_test / dvc.yaml::confusion_matrix as a "plot path" for the tree highlighted below:
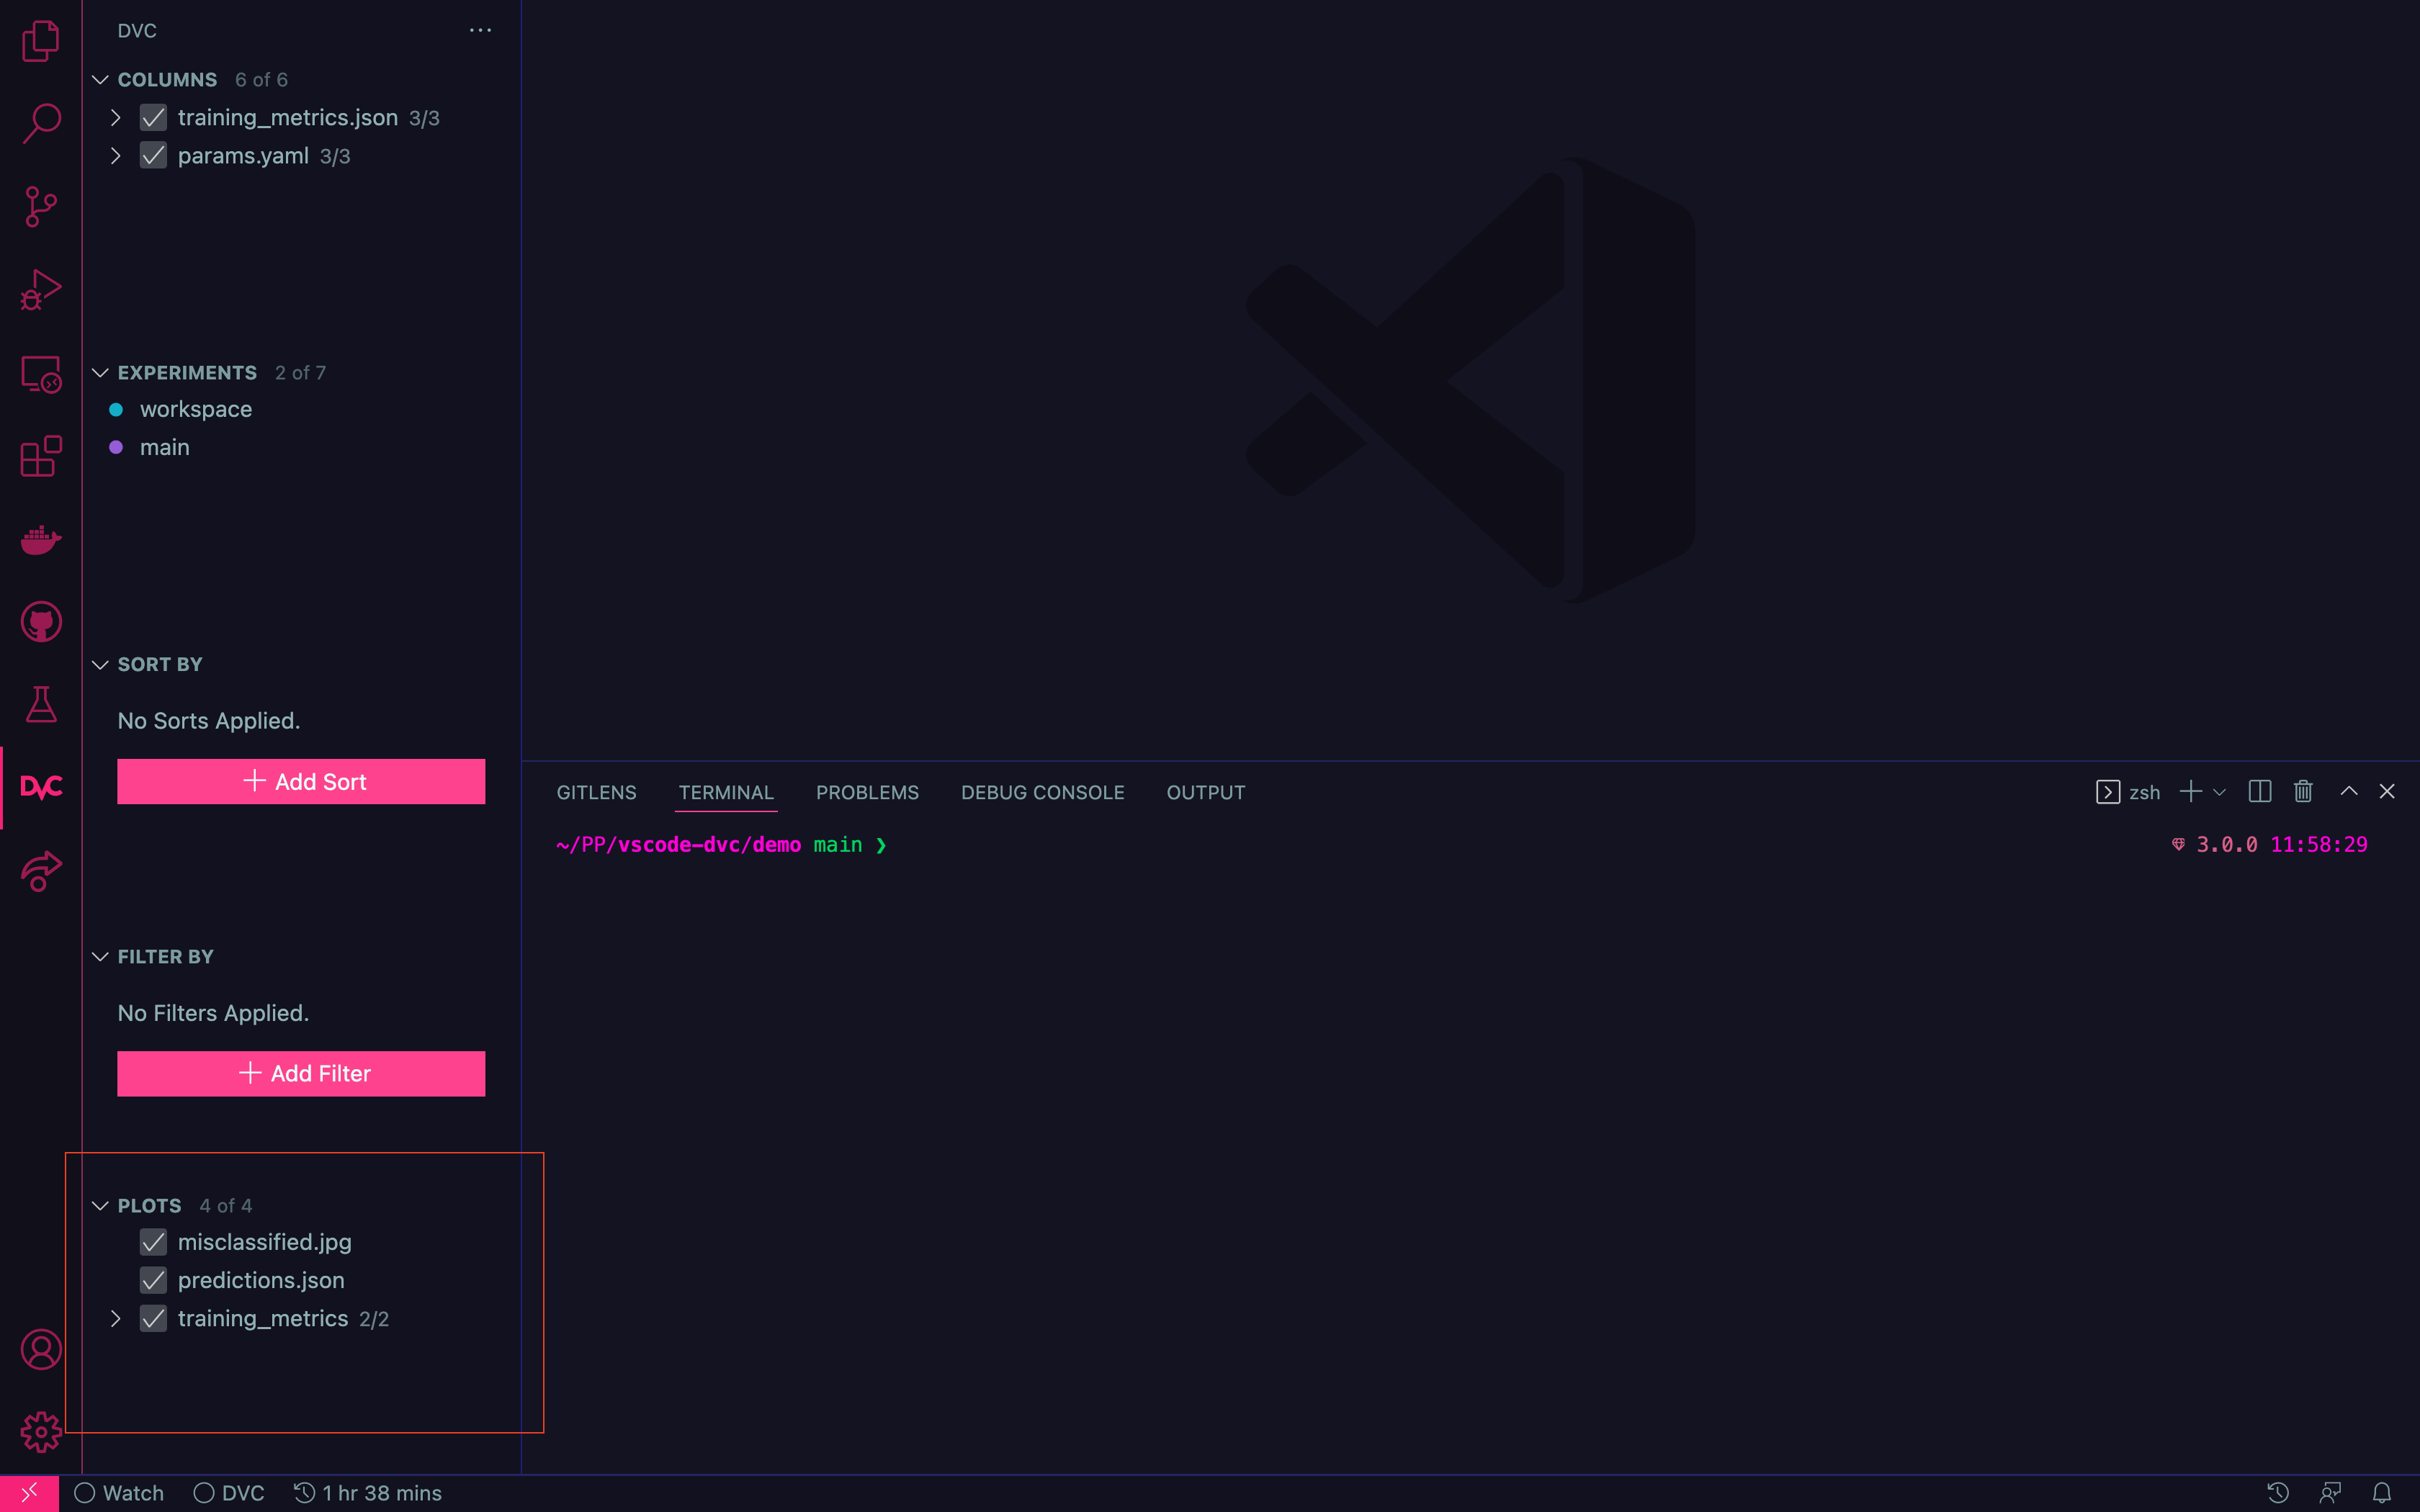
Under these circumstances, we should probably nest multiple plots under a dvc.yaml parent.
In the above what is the difference between "test_accuracy" & "dvc_inferred_y_value"
in the example above you are comparing test_accuracy with test_loss. We cannot tell the template which field to use if it name is different in different files, so we need to create a new one - hence dvc_inferred_y_value. Though, you are right that we could get rid of test_accuracy if we infer a new value.
Regarding moving from overcomplicated revisions to list of dict:
how does the information contained in revisions relate to the datapoints returned by dvc?
What I mean here, is that datapoints will still have rev field which will be this long and faulty id. Would you like to change that? It might impute some changes in dvc-render.
I like the line type idea. Added it as a follow-up issue in https://github.com/iterative/dvc/issues/7809.
DVC render assign colors in this case?
There is no logic regarding this. Its vega default behavior when grouping particular data series.
Quick update. @pared has been iterating on the API and we have been discussing possible solutions/data structures.
Also, I am modifying iterative/dvc#7447 to make --json return only "old" plots (output plots) in order to not block it from being merged. Once we agree on data structure, we will unlock flexible plots for vscode.
Update: We've verified that flexible plots will not be shown in VS Code (and nothing will break) after the PR is merged.
We still need to discuss how we will cater to these plots in VS Code. The initial thought is to go with the different line types but we will still need a way to show this in VS Code. We can maybe bring back the legend specifically for these types of plots.
If any changes need to be made to the default templates then we should consider #1957.
We should discuss this at the next cross-team planning meeting and talk about priorities 👍🏻.
@pared has volunteered to take the lead on this, so please go ahead and discuss with him without waiting for cross-team planning meetings. He should be able to help drive this even on the VS Code side.
Would it be possible to divide the color space in two complementary regions? One for each domain?
Would it be possible to divide the color space in two complementary regions? One for each domain?
There are potentially more than two domains for each revision. I think line types can handle up to 5 but at that point, the plot is going to be confusing no matter what we do.
Update on this: @pared is working on making it possible to determine from the JSON which plots are "flexible" so that it's possible to continue treating the traditional ones the same way and have separate rendering logic for the flexible ones. Then either he or the VS Code team can work on how to render those flexible plots in VS Code.
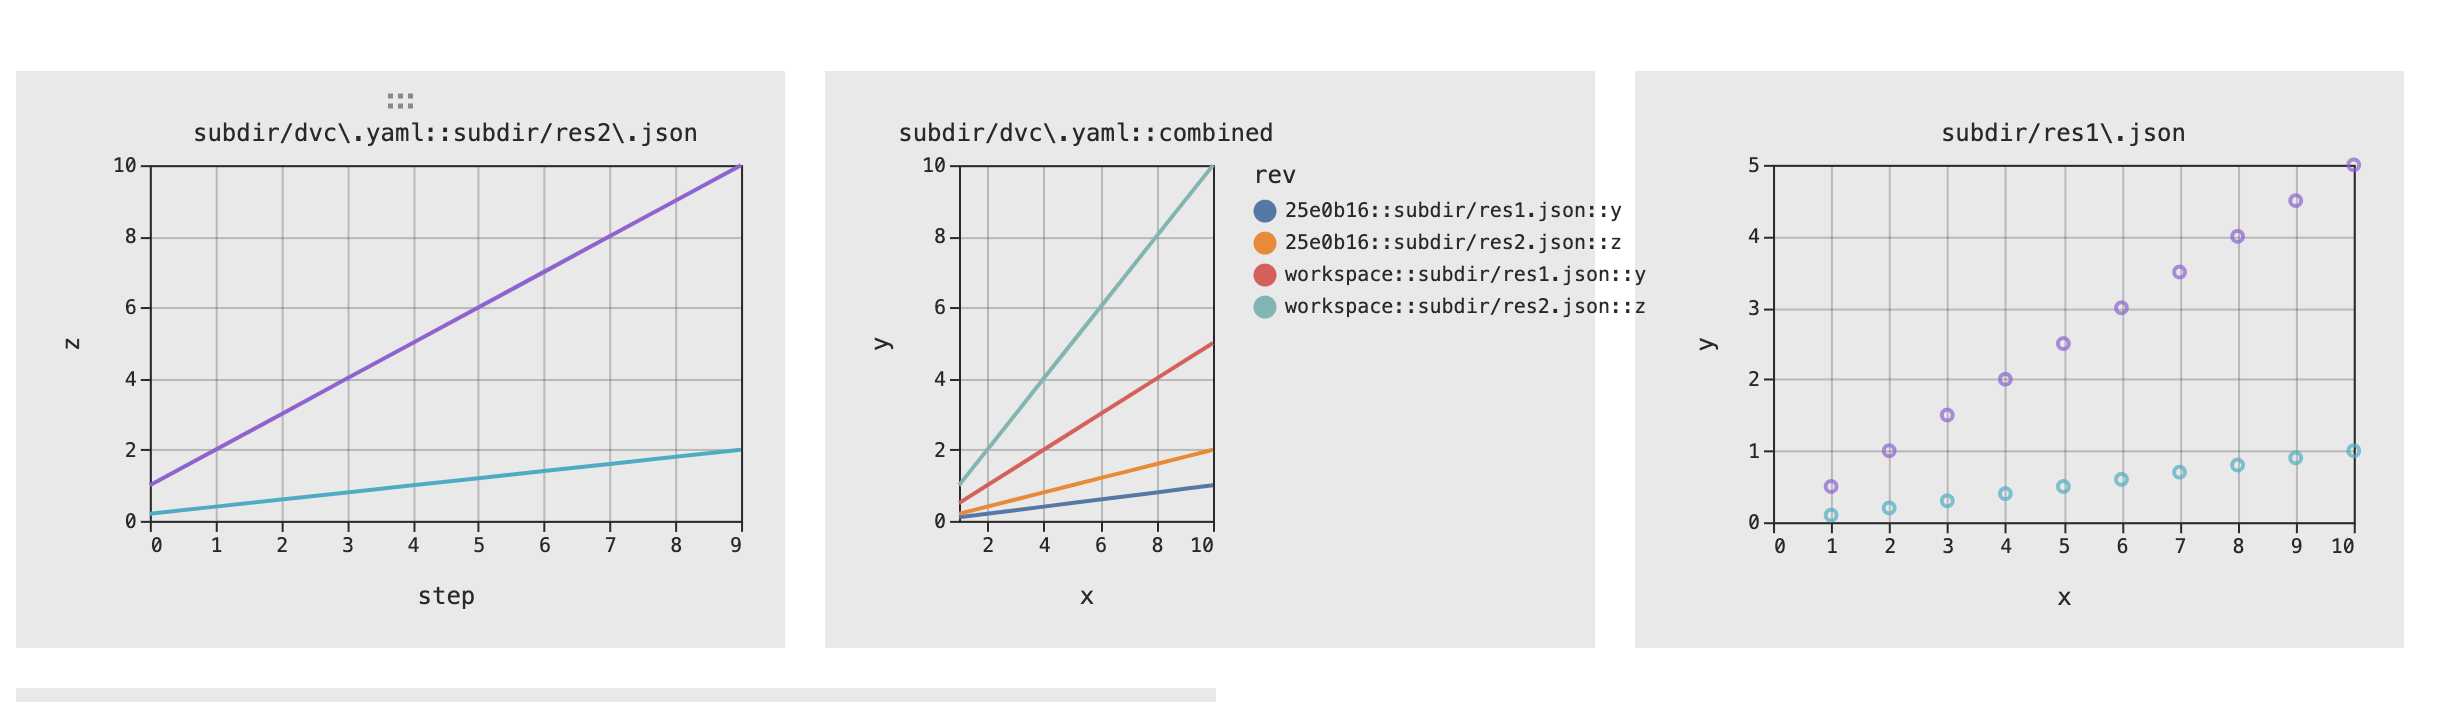
We need to conduct some discussion regarding how ideally plots colors overriding works, in both studio and vscode. Till we know what we stand on flexible plots (linear) will work as follows:
- simple plots will have their colors overriden
- complex plots (the ones sourcing data from multiple sources from single revision) will have their colors assigned by vega.
Example:
Folks, unless I'm missing something, it breaks the product experience. What would be the reason to release it with a broken color schema that might confuse users? We need to introduce additional dimension (line type) to this. If this is not possible we need to start reconsidering the whole approach (that Studio and VS Code take) asap.
@shcheklein the experience has always been broken - confusion matrix does not comply with color schema. IMHO it's better to let users have working flexible plots. Regarding coloring schema we need to discuss how we would like our plots to behave, both for Studio and vscode (though after looking at both projects it looks to me that use cases are very similar). Only then should we decide what to do with the plots, and start changes.
Also, we can just add another section - like "Complex plots" that would be separated from "old" plots.
confusion matrix does not comply with color schema.
could you clarify please? I don't see any issue with it now
IMHO it's better to let users have working flexible plots.
Hmm. My take that that it'll be messy.
Question: what is the reason to release this "broken" implementation anyways if plan to do it properly anyway? Can we first plan / discuss some suggestions how to mitigate it properly and decide after that?
Question: @pared what prevents us from introducing different line types into plots?
The changes in https://github.com/iterative/dvc/pull/8282 should have all the info needed to introduce an additional line type. An example data point:
          {
            "actual": "1",
            "predicted": "0",
            "dvc_data_version_info": {
              "revision": "exp-3599a",
              "filename": "evaluation/test/plots/confusion_matrix.json"
            },
            "rev": "exp-3599a::evaluation/test/plots/confusion_matrix.json"
          }
I think the remaining changes should be on how to handle this info on the front end. Is that correct @pared?
There are few things to clarify here, some general points:
- Do we want to colour/adjust lining for other templates? (eg, confusion_matrix, that's why I said its broken, as they do not follow revision colors) - it makes sense to me that in this case coloring does not matter that much, but I need clear guidelines how all currently supported templates should behave.
- switching from
revtodvc_data_version_infowill require changes on our templates -revfield is hardcoded there, so we will probably need to modify all templates and prepare backward compatibility for dvc versions that do not provide this field - Updating coloring is a new way of updating the plots - we used to rely on string anchors, now we will also modify the template as dict - should it be like this?
- vscode and studio changes the plots on FE side - we need to decide what are we going to do with that - should we create common library that will allow for this kind of operations?
Taking those point through is necessary, I just thought that we want to make it work, and later adjust to the results of discussion.
- I don't think color makes sense for confusion matrix since there is a scale and it should be consistent across all plots. It would be nice to designate the color of the experiment somewhere like in the subtitle, but I think that's not needed right now.
- I think it's fine to keep both
revanddvc_data_version_infofor now like you do in https://github.com/iterative/dvc/pull/8282. - I would prefer to wait before diving into handling line styles inside DVC, although it would make sense to create an issue and/or start discussion on it.
- I would prefer to try to create the line styles within VS Code since it seems like the easiest path to get some prototype working, but open to other suggestions.
IMHO it's better to let users have working flexible plots.
@shcheklein Since users are waiting to be able to see top-level plots in VS Code and Studio, what are your concerns with this approach? What do you have in mind? I think the point from @pared about confusion matrices was that not all plots have colors that align to experiment names, so initially showing flexible plots with colors that don't align to experiment names may be a reasonable first step.
Probably worth noting that the best Vega-lite can do here is provide two legends rather than combine the color and dash stroke:
https://github.com/vega/vega-lite/issues/3797
@pared @dberenbaum
@shcheklein Since users are waiting to be able to see top-level plots in VS Code and Studio, what are your concerns with this approach?
no concerns with making top level plots working asap (I was thinking more about flexible plots - multiple lines per experiment). Will we have to break colors for pretty much all plots in this case?
I have a working prototype:
https://user-images.githubusercontent.com/37993418/190308174-f63647b3-d0f6-4e58-8f76-9c21ed04a2ba.mov
In the prototype, the legend is disabled unless a plot is zoomed. I think this is actually ok but happy to be corrected. The way that I imagine people would use this would be: webview is a dashboard which gives an overview. If I want to interrogate a plot then I need to click on it to see further details.
What does everyone think?
Looks great, @mattseddon !
Regarding the legend we could pick ideas from the TB:
https://user-images.githubusercontent.com/3659196/190311755-1498ebb2-e28b-4969-83e8-b6165a7f1071.mov
I think that tooltip with metrics is way better compared to what we have (I wonder if we could implement something like this in Vega - cc @daavoo )
Also, we can consider expanding the plots tree in side panel to serve as a legend similar to TB.
(I wonder if we could implement something like this in Vega - cc @daavoo )
Tooltip with multiple fields can be added, but it won't look as pretty as tensorboard, example:
https://vega.github.io/vega-lite/examples/interactive_multi_line_pivot_tooltip.html
I would prefer to try to create the line styles within VS Code since it seems like the easiest path to get some prototype working, but open to other suggestions.
One downside with this approach is that, as we start putting custom vega rendering logic into VSCode/Studio, it becomes messier for users to use custom templates. It is not clear what things will be ignored/overwritten by the UI.
For example, what would happen if a user wants to use flexible plots with a template using facets? Or a custom Legend?
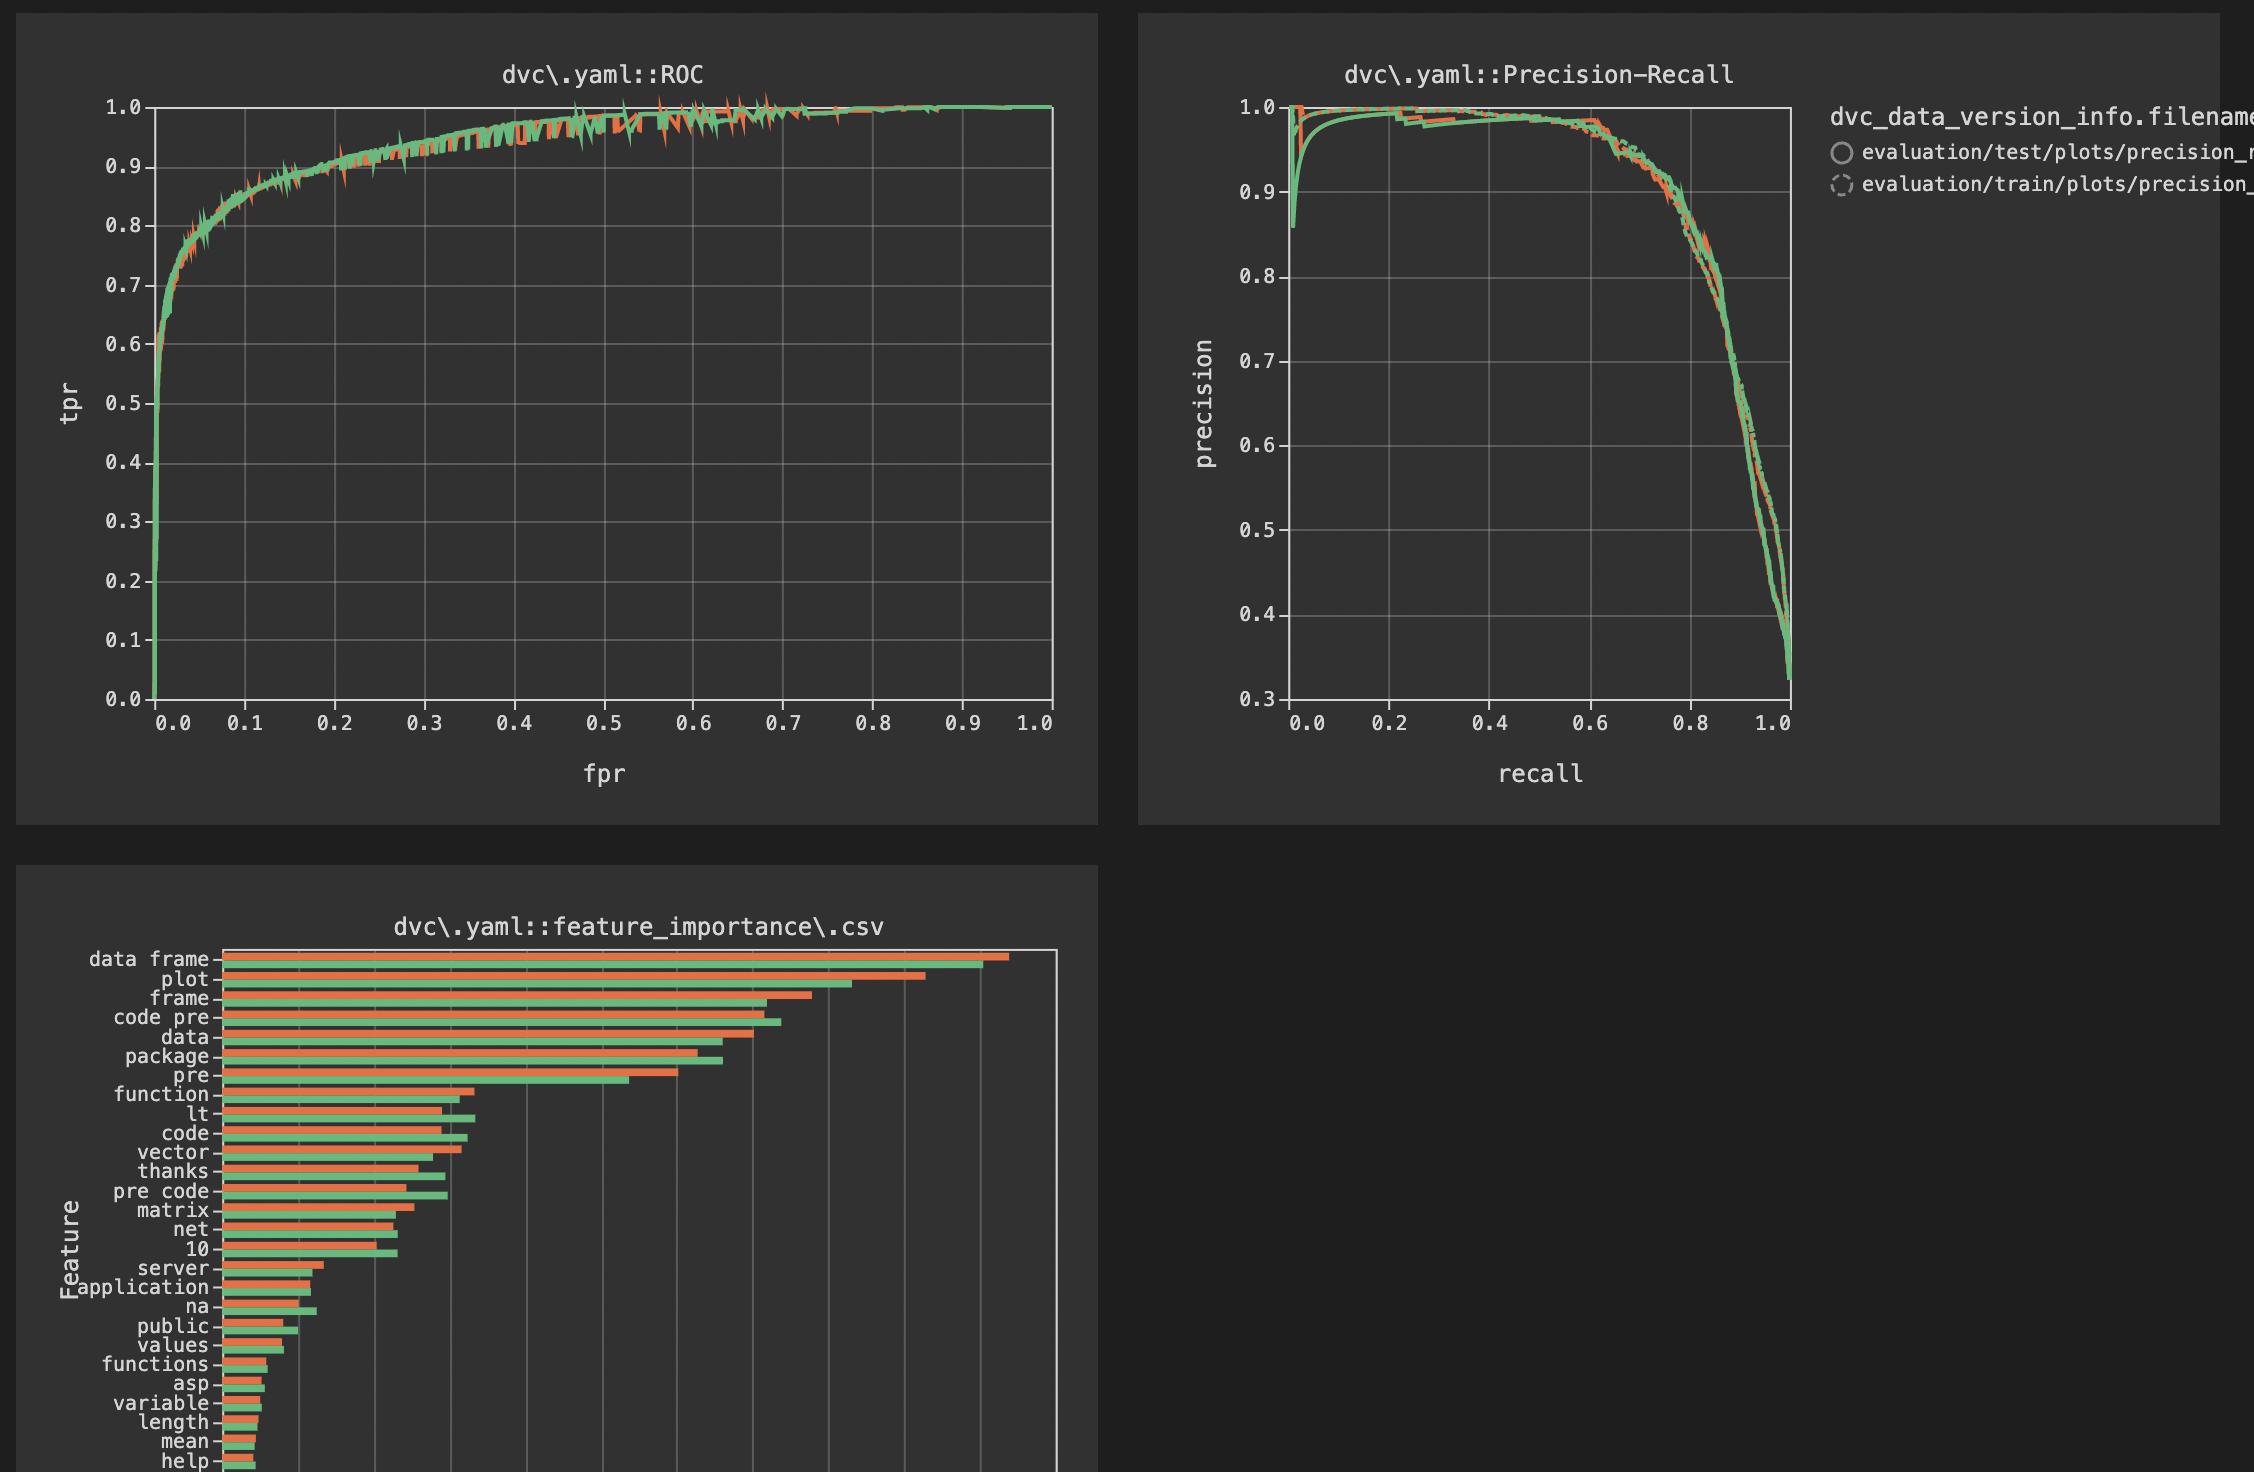
Good point, @daavoo. Does VS Code try to override color any time there is a "color": {"field": "rev"}? It looks like it is applied pretty aggressively, including the new bar template and custom templates:
Also, is it possible there are more dimensions than exp/git rev and filename @pared?
It is possible to use dvc_data_version_info, as a version reference. In the beginning, we hardcoded rev which will need some backward compatibility changes, but yes, it is possible.
@pared Can there be additional fields in dvc_data_version_info besides revision and filename?