vscode-dvc
 vscode-dvc copied to clipboard
Plots: handle errors gracefully
This depends on https://github.com/iterative/dvc/issues/7692
Motivation
- Will be missing data for a specific experiment within one of the plots. This will be most apparent in the comparison table. We need a placeholder and some way to refresh the missing experiment's data.
- Currently, if an experiment completely fails to load plots data there will be nothing to let the user know the experiment is missing. Add an indicator into the webview's top experiment selection section in order to let the user know that an experiment has something wrong.
TODO
Will be handled in relation to the: DVC errors that may occur during or after running experiment #1636
- [x] Placeholder and refresh https://github.com/iterative/vscode-dvc/issues/1649#issuecomment-1128348855
- [x] Missing experiment indicator https://github.com/iterative/vscode-dvc/issues/1649#issuecomment-1128387551
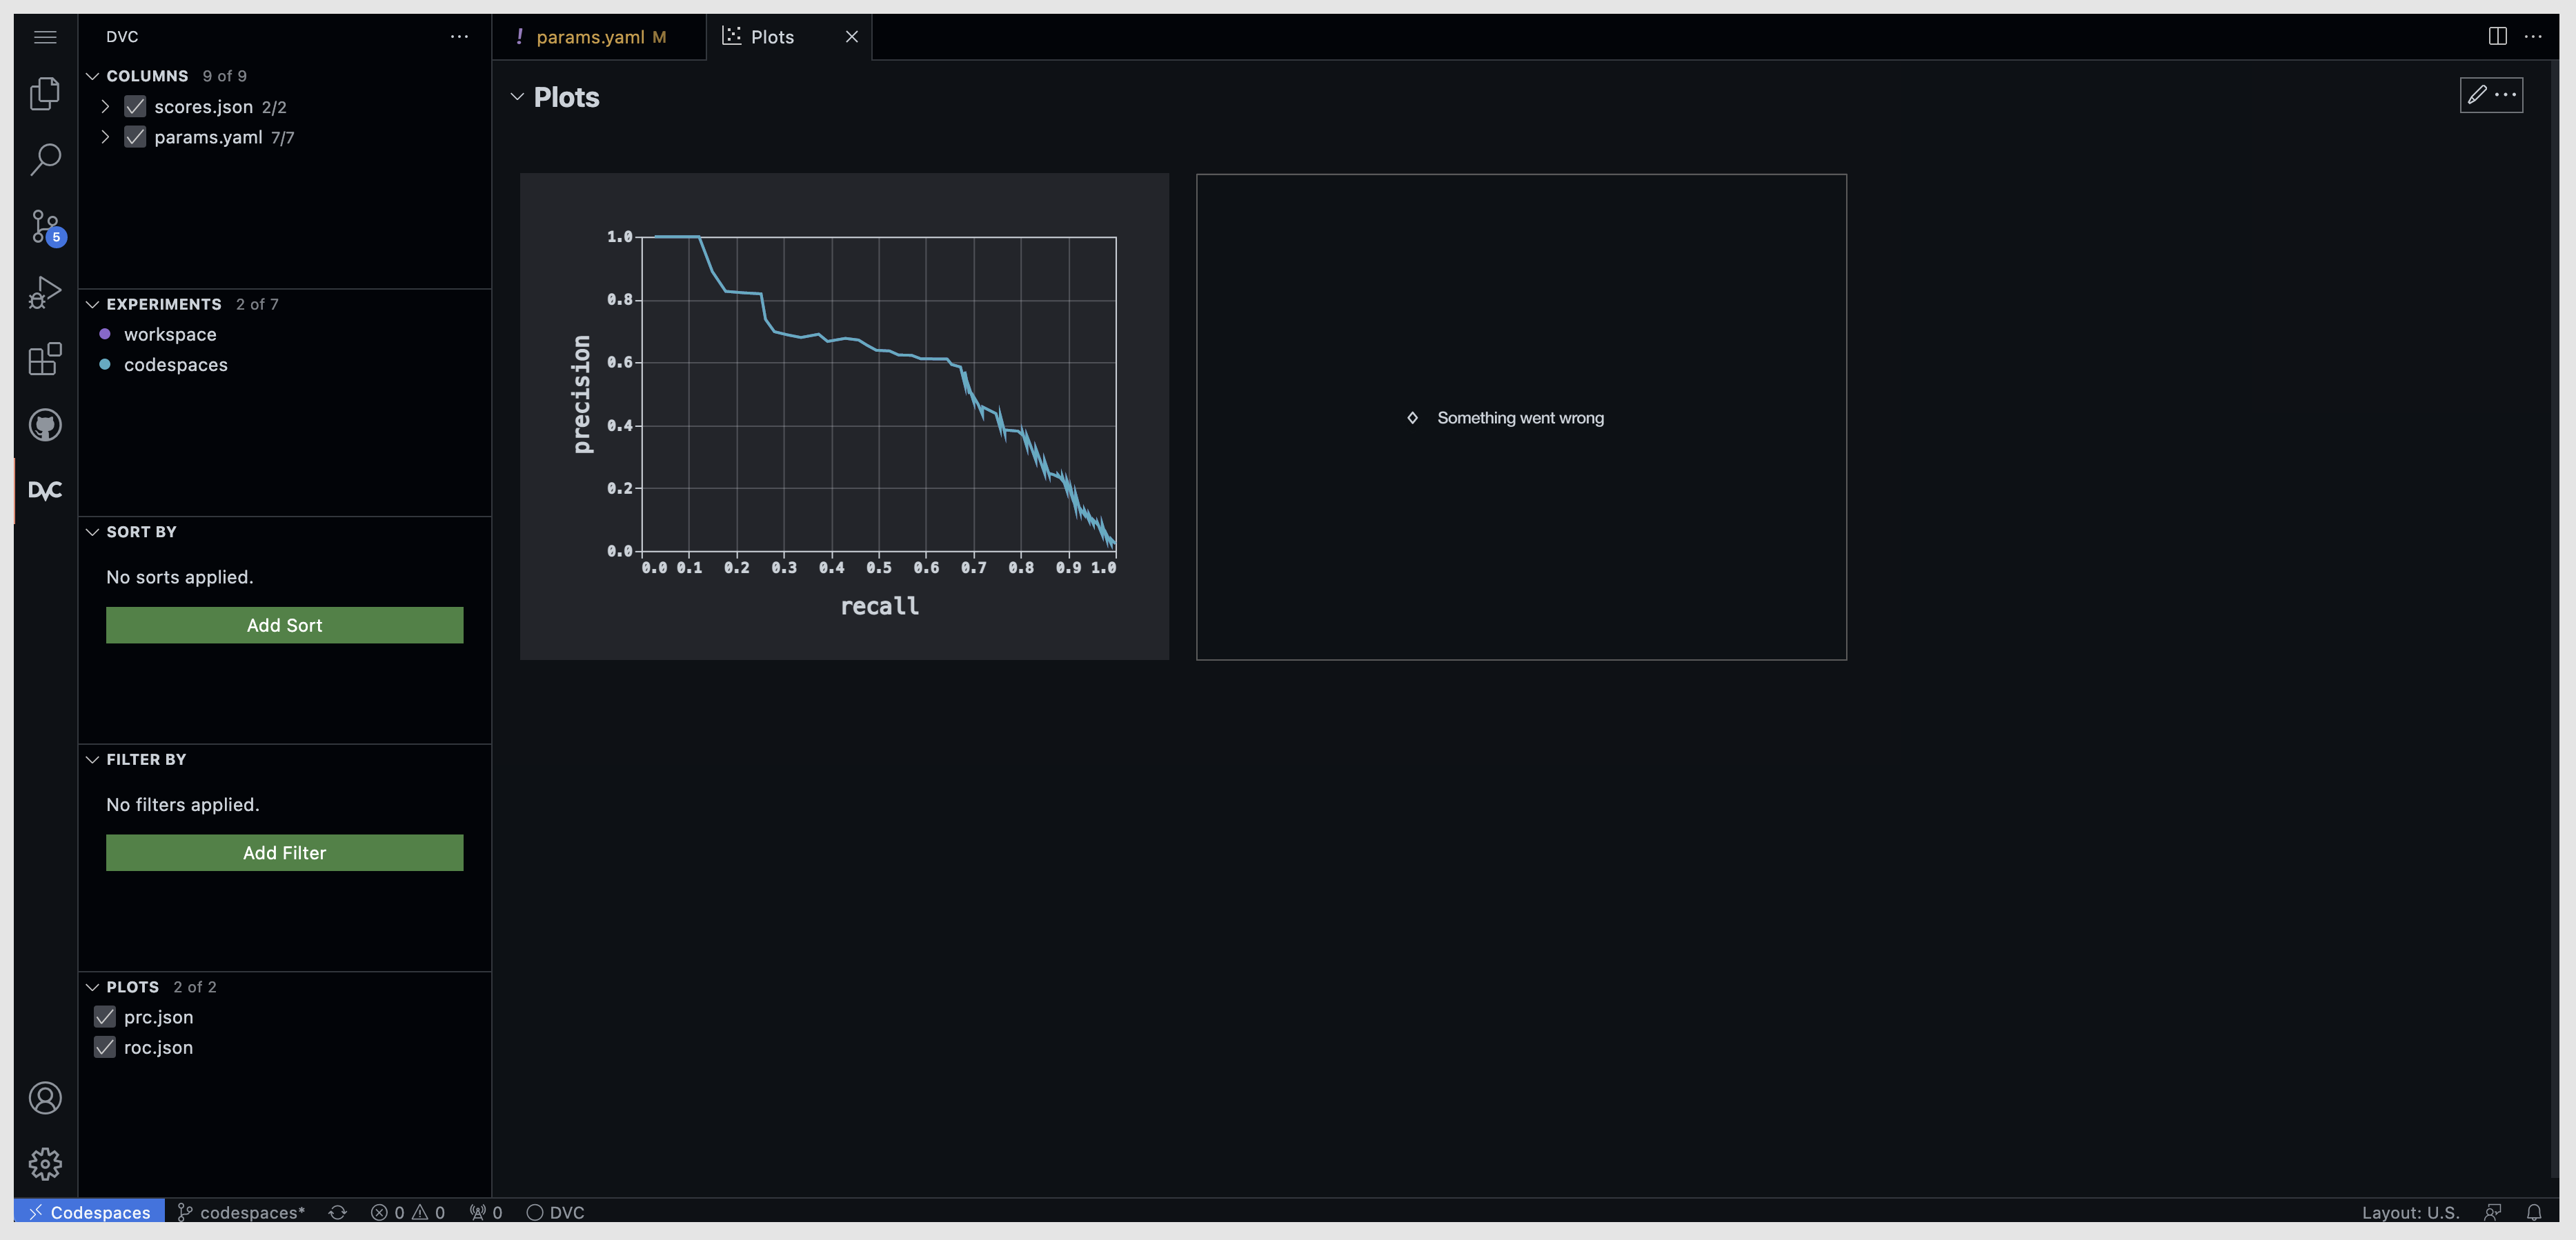
@maxagin it's more likely that we'll have all of the plots but we will be missing data for a specific experiment within one of the plots. This will be most apparent in the comparison table. This is what currently happens when we have no data for an experiment:
IMO we need a placeholder and some way to refresh the missing experiment's data.
Can I use the above placeholder in this situation?
What is the significance of the rhombus?
Worth noting that the extension UX guidelines state we should try and stick to the codicons in views wherever possible.
the extension UX guidelines state
Yeah. I would say, we should be able to find solutions based on the VS Code fundamentals.
What is the significance of the rhombus?
Using it as a placeholder for the error mark (currently exclamation mark). WIP
@mattseddon I think we may want to use buttons where it is possible. take a look and let me know.

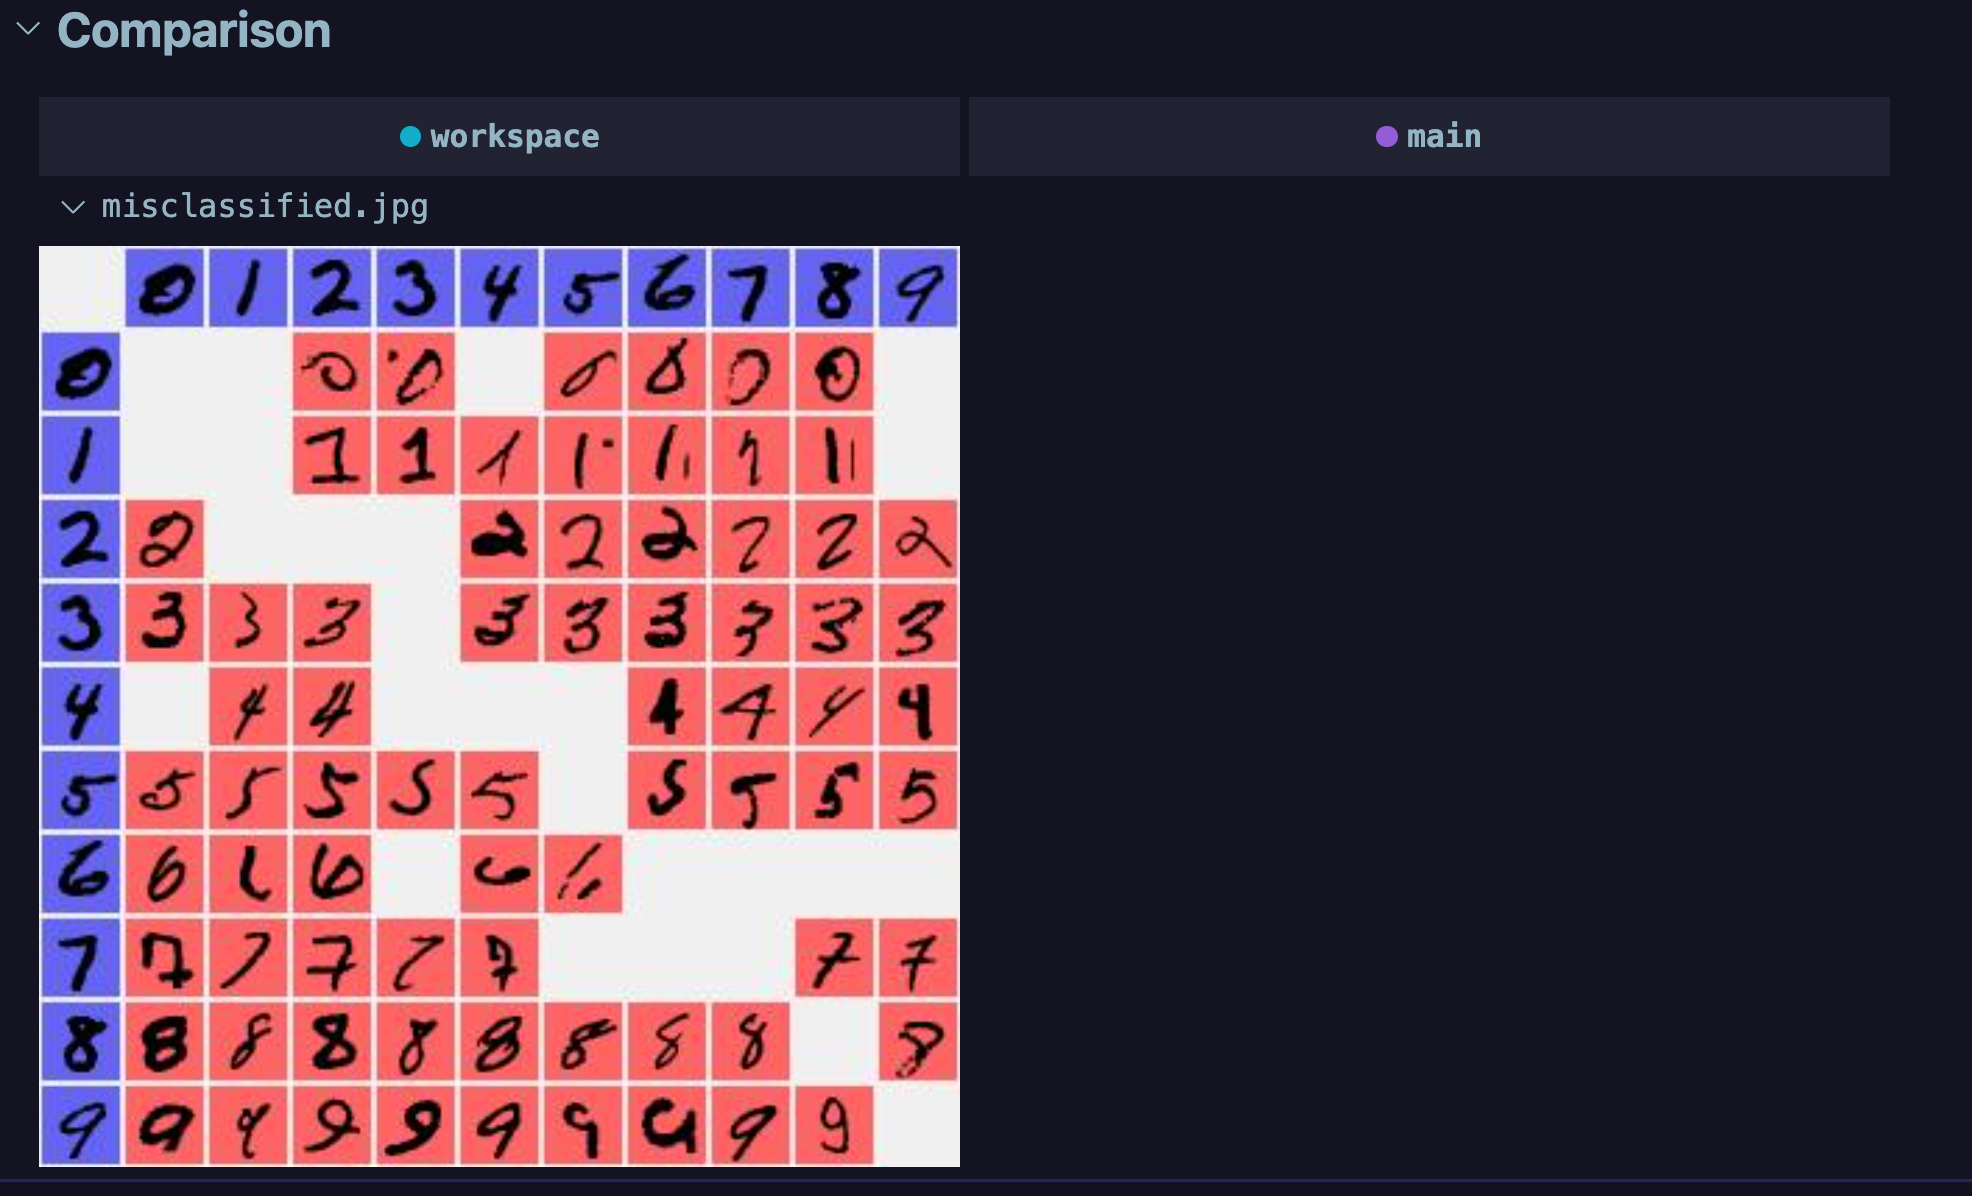
Currently, if an experiment completely fails to load plots data there will be nothing to let the user know the experiment is missing.
IMO we will also need to add an indicator into the webview's top experiment selection section in order to let the user know that an experiment has something wrong. I.e the top section of the proposed design:

WDYT?
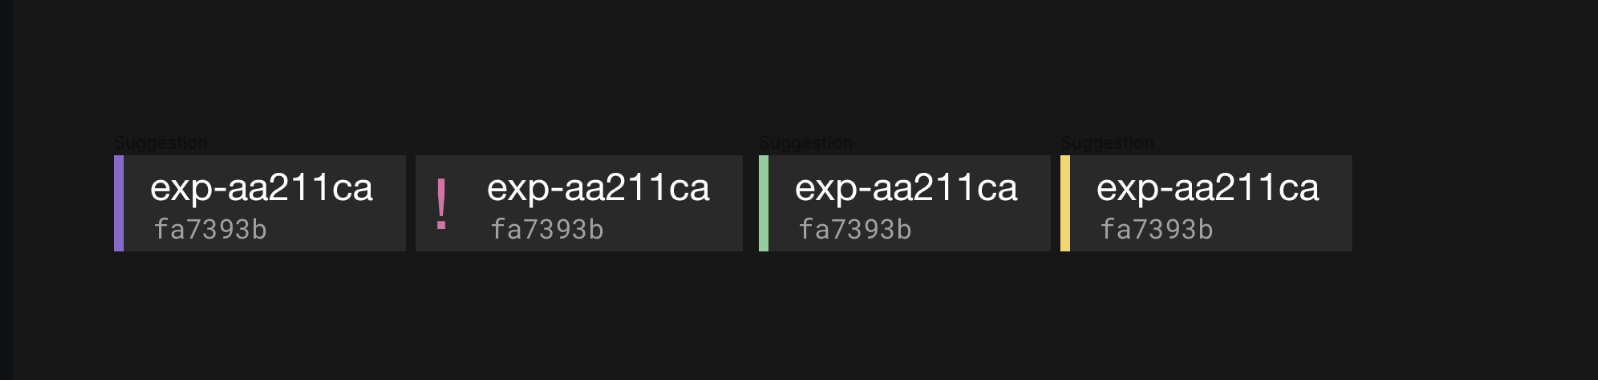
Signal user that an experiment has something wrong at the tabs level. We can use the exclamation sign (will be using it for similar cases - errors) colored with the section color.

Keep the tabs appearance consistent with the expS table and side panel. Wdyt?

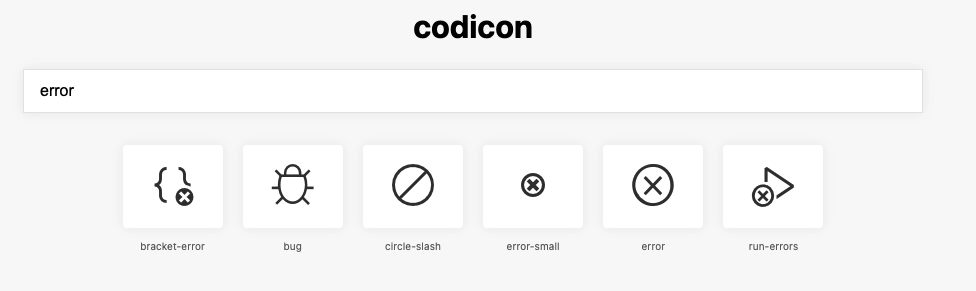
I think the "broken" experiment will still need a color to tie it back to the tree and the table. For example, if two are broken it could take a while to work out which ones they are. Also, VS Code currently doesn't use any exclamation points but they do have an error symbol:

If we use any of these symbols we would also be (easily) able to show them in the tree (and other webview)
if two are broken it could take a while to work out which ones they are
The exclamation mark color is the same as exp it belongs to. Sorry if this was not clear.
If we use any of these symbols we would also be (easily) able to show them in the tree
THank you for sharing. The “!” comes from Studio. The usage of other symbols is a good idea https://github.com/iterative/vscode-dvc/issues/1649#issuecomment-1128478004, but this will require review of all messages. Also we will probably start using “!” for the errors in VSCode https://github.com/iterative/vscode-dvc/issues/1636#issuecomment-1123967155. Wdyt?
I would like to finalize this if possible. Please share your comments. @shcheklein and @mattseddon Thanks
@maxagin
This is fine. Please update the designs in the figma. We need to start consolidating all of this information in to one place so we can prioritise what we are going to implement next. We also need to make sure there is no contradictory information anywhere. E.g dots vs strips for the experiment colors.
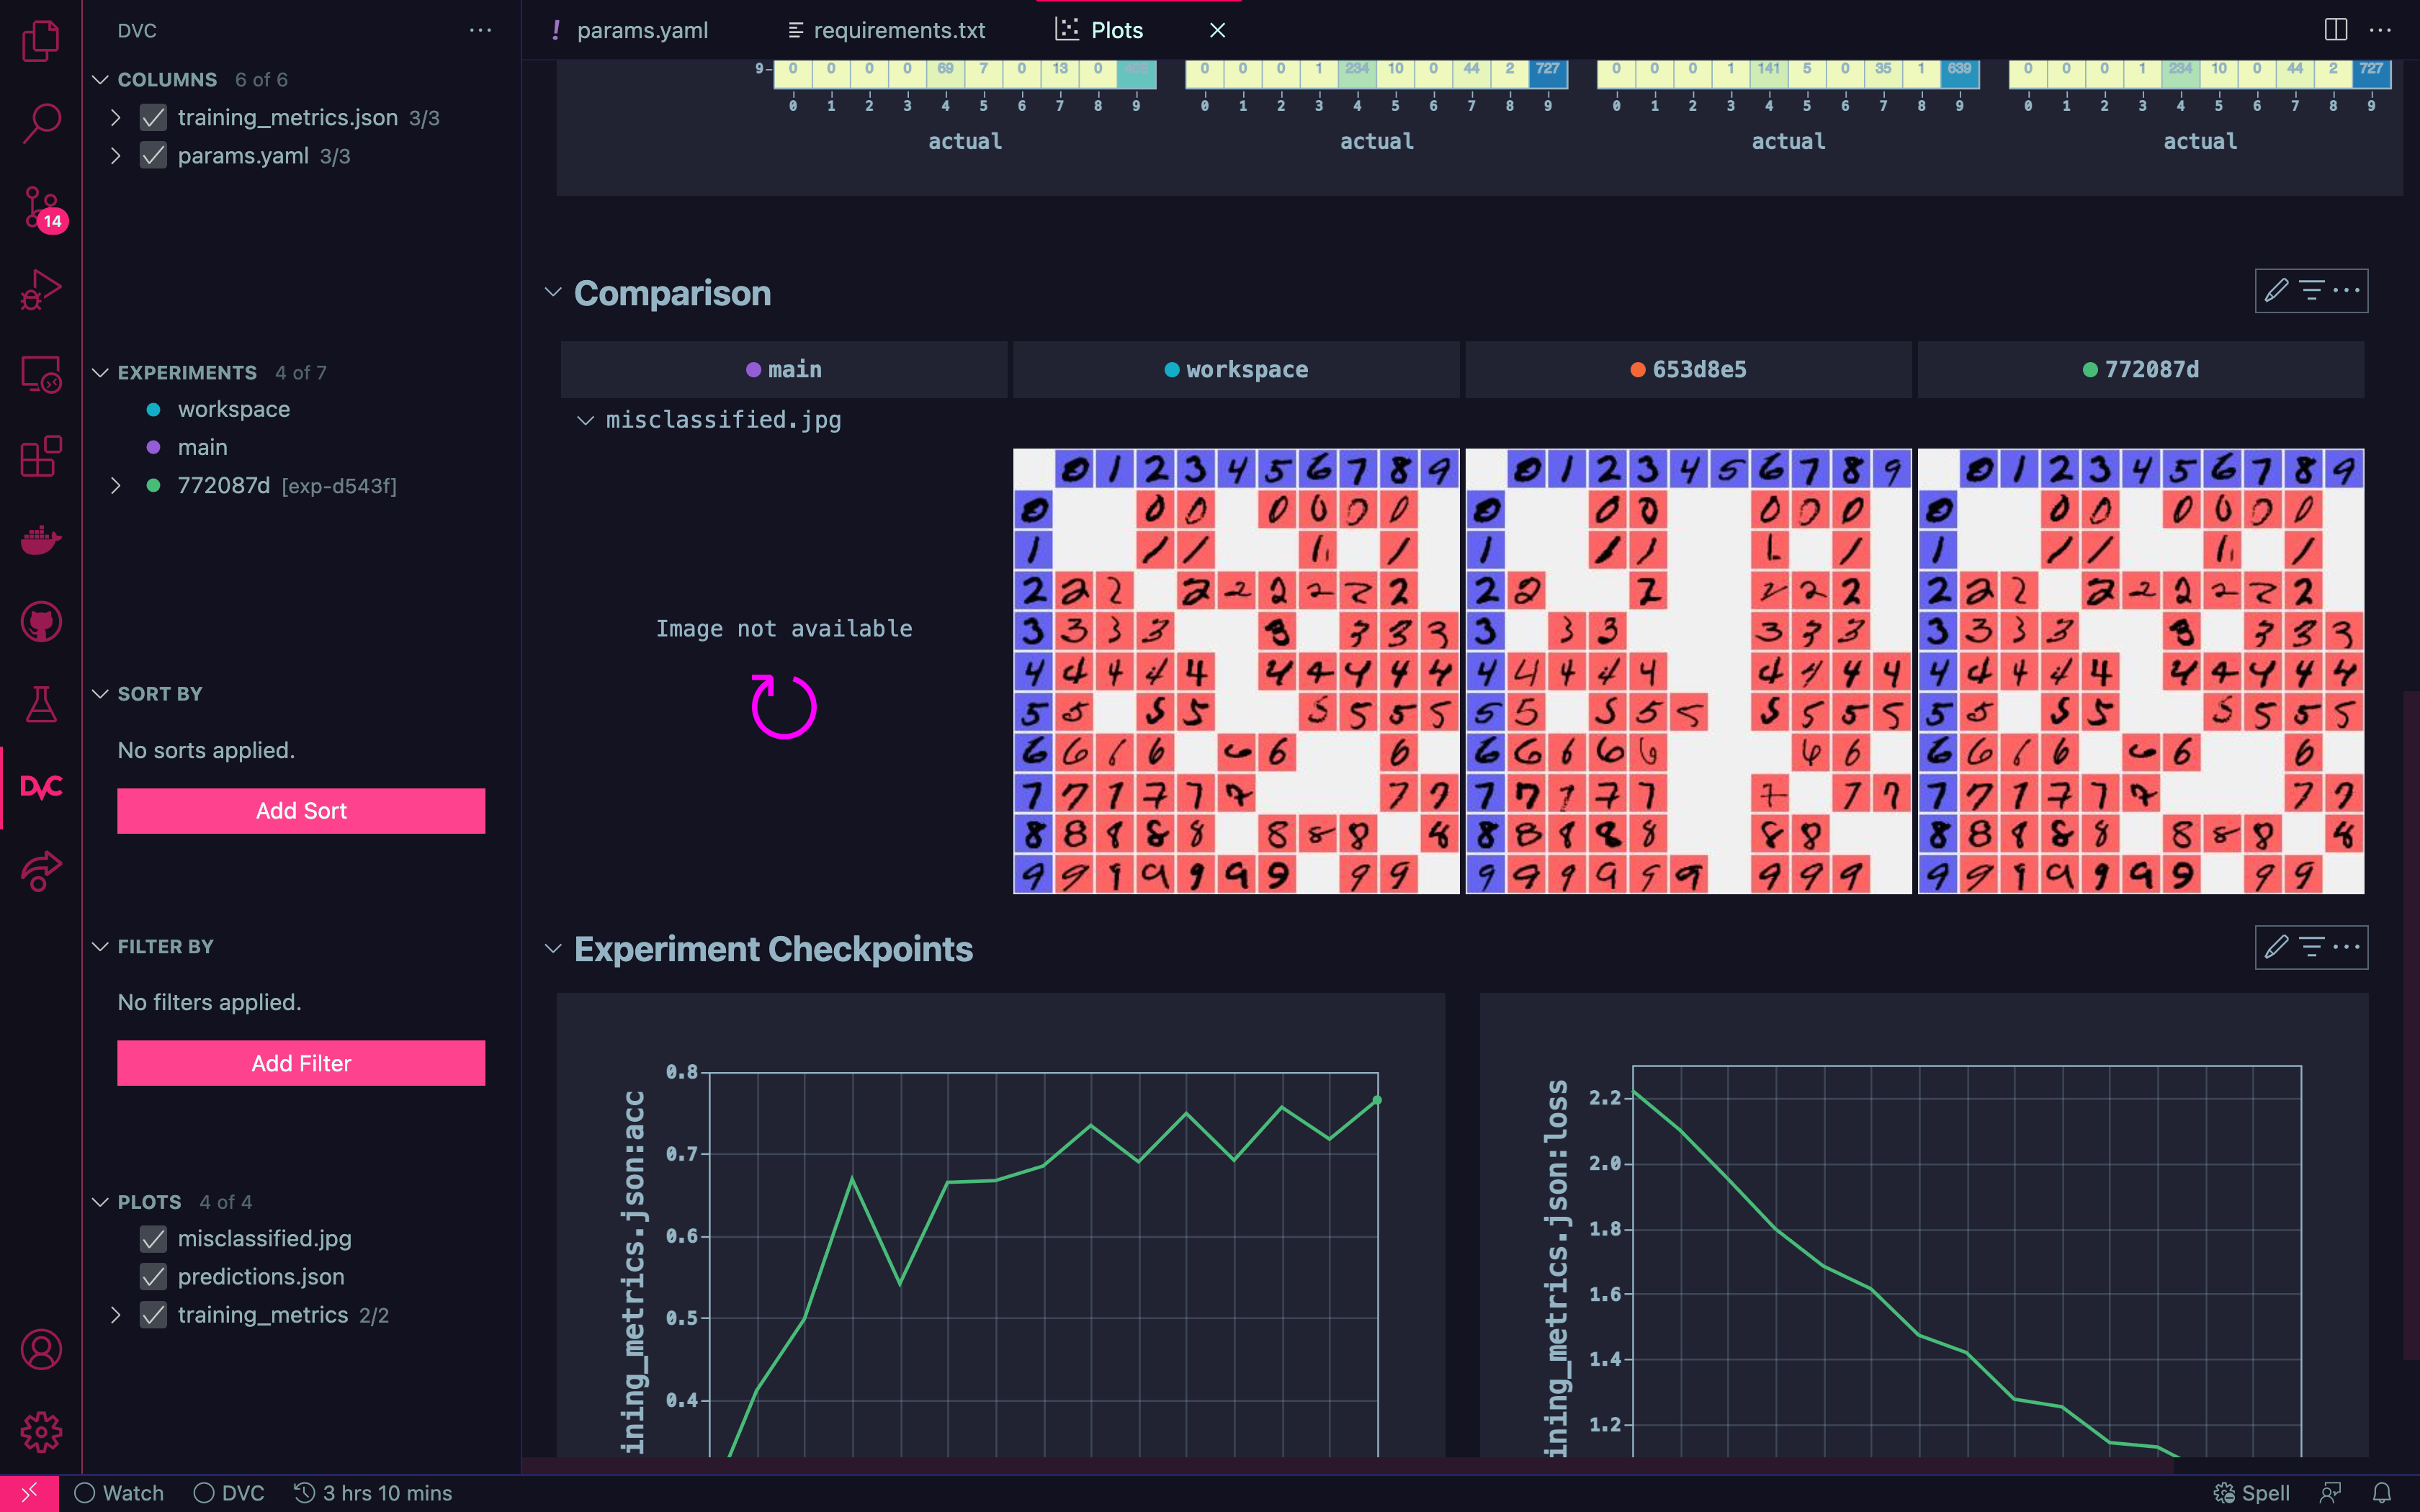
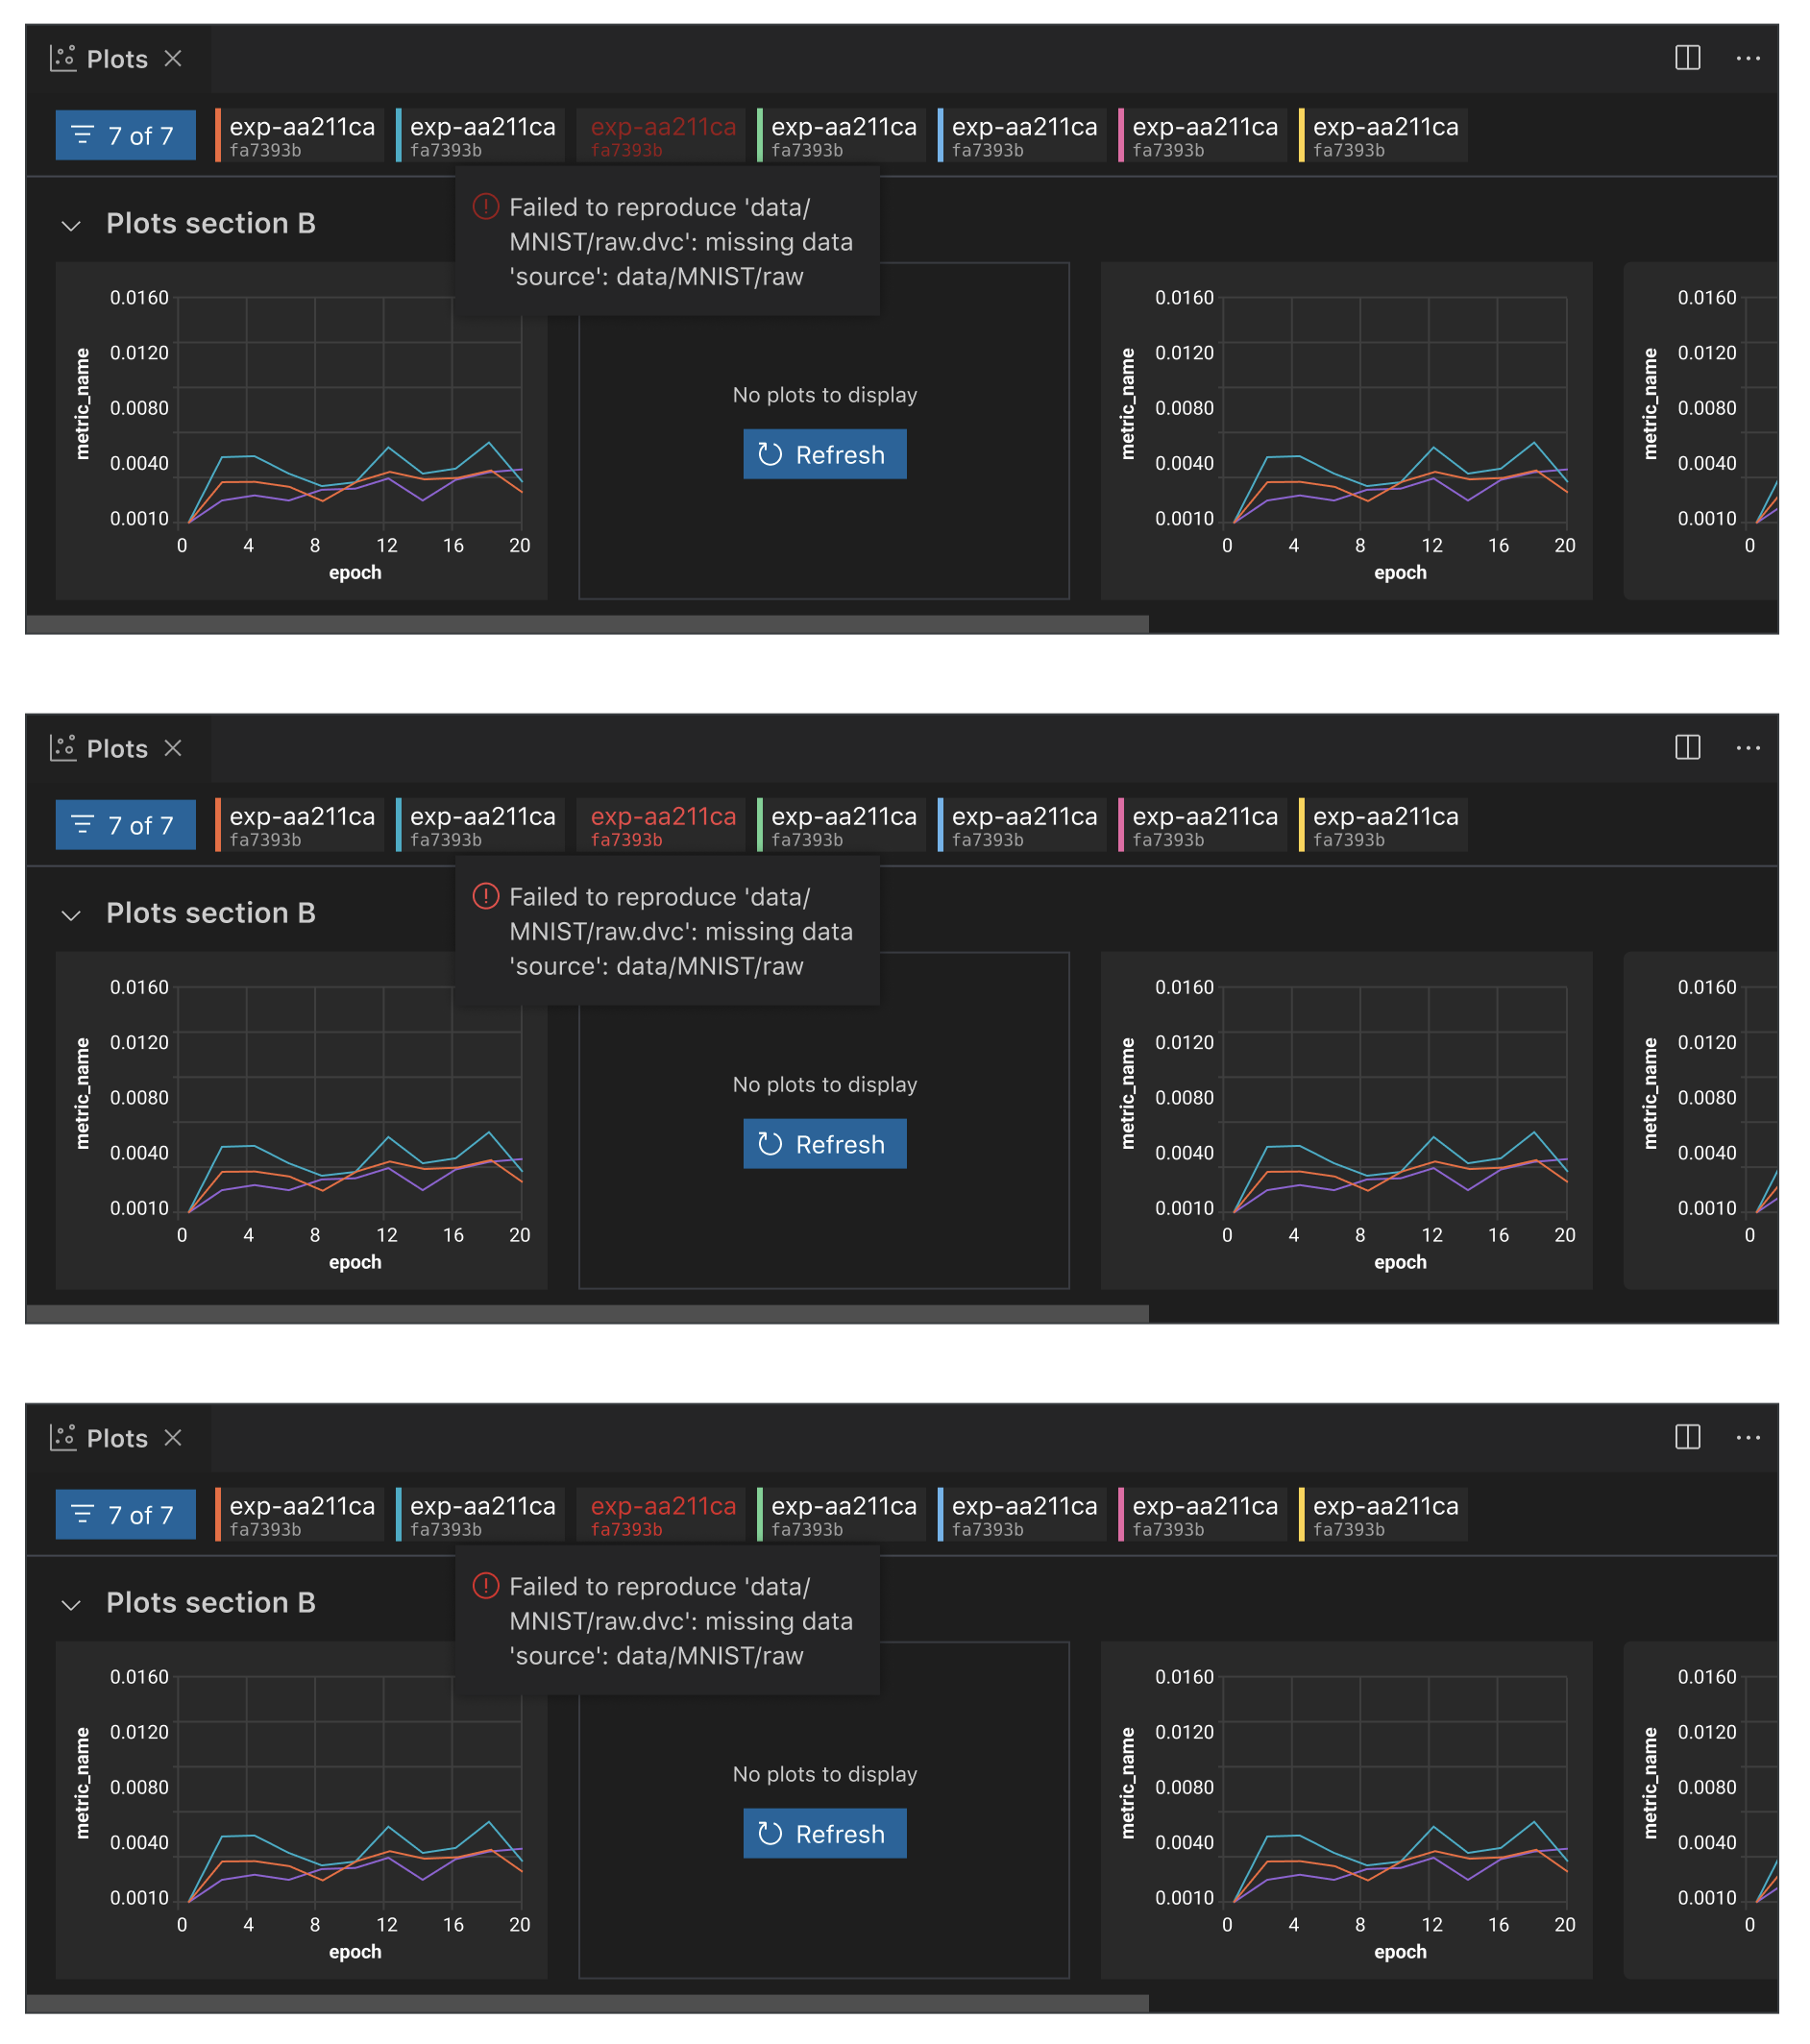
Implemented the refresh button in #1754. The concept looks strange when there are multiple plots missing:

Consider leaving for now but removing the button altogether once the ribbon is in place.
Great ! @mattseddon just a few comments:
The concept looks strange when there are multiple plots missing
The reason is that the area is not defined. With the border it will be fine. See here https://github.com/iterative/vscode-dvc/issues/1649#issuecomment-1128348855
refresh button
I have noticed that most of the time buttons have significant clear space (padding) on the sides. I propose same, should feel more consistent. See here https://github.com/iterative/vscode-dvc/issues/1649#issuecomment-1128348855
The reason that I say that it "looks strange" is because we have a refresh button on each plot that does the exact same thing. I do not think that adding a border will make the duplication of information/button look any better:

The buttons are from the webview-ui-toolkit. I am using them as provided by MS. Please take a look.
I am using them as provided by MS
I had an impression that we can have it 100% of the parent container, like in the attachment. Sorry if I was mistaken.

adding a border will make the duplication of information/button look any better
Yes. It won’t do the duplication any better, but it will outline the space with the message. So the user won’t feel like the info is in the air, but it belongs to a specific place. Does it make sense?
we have a refresh button on each plot that does the exact same thing
Do you mean if the user will click one button it will refresh all the missing plots. I thought that one button refreshed info related to the specific plot. If by clicking one button all plots will be refreshed - then it does not make sense to have a button for each section and the button needs to be located somewhere else ‘general’ refresh.
I am using them as provided by MS
I had an impression that we can have it 100% of the parent container, like in the attachment. Sorry if I was mistaken.
Generally the only place that you would see a button like that would be in the sidebar panel. Whenever buttons are shown in the toast or any webview-toolkit-ui previews they have much less space between the edge and the text/icons


we have a refresh button on each plot that does the exact same thing
Do you mean if the user will click one button it will refresh all the missing plots. I thought that one button refreshed info related to the specific plot. If by clicking one button all plots will be refreshed - then it does not make sense to have a button for each section and the button needs to be located somewhere else ‘general’ refresh.
It will refresh all plots for that revision/experiments. Hence this comment:
Consider leaving for now but removing the button altogether once the ribbon is in place.
Whenever buttons are shown in the toast or any webview-toolkit-ui previews they have much less space between the edge and the text/icons
Yes, but I thought this is also a webview and it uses the full width of the content wrap. No?

However if the button needs to refresh all plots of a particular exp, it doesn't matter . Thank you @mattseddon
The provided picture is from a walkthrough which probably uses a webview under the hood but it is internal to VS Code and does not use the toolkit.
Hey @mattseddon . Please see the Figma specs which I have recently created. Let me know what you think.
Hmmm.. this is what we have agreed to use for DVC errors that may occur during or after running experiment
Will try and share some more options.
Hmmm.. this is what we have agreed to use for DVC errors that may occur during or after running experiment
no worries, that's fine!
I thought we agreed in #1636 that you could not select an experiment that is a full error record?
Select not, but on hover yes - we show the information. Same as in https://github.com/iterative/vscode-dvc/issues/1636 No?
In order for us to show an experiment in the plots webview it has to be selected. If it cannot be selected, it will not be displayed.
Ok. What is this then?
Signal user that an experiment has something wrong at the tabs level. We can use the exclamation sign (will be using it for similar cases - errors) colored with the section color.
Partially broken experiment that isn't currently highlight as per design?
Well, I have just created a different way of displaying the errors, a part of this is the same.

So, what we will do here. Do we need the error for the exp tab?