python-irodsclient
 python-irodsclient copied to clipboard
Retrieving large files causes unacceptable resource usage on catalog server
When using put() to upload files, the resource usage on the catalog server per transfer is minimal, but can add up for large numbers of (large) files (see #375). For get(), the resource usage can be unacceptably high.
Uploading a large file (GBs in size) via put() transfers the data to the catalog server which streams it to a resource server (no redirected connection). This operation appears as efficient as it can be. When the file is downloaded with get(), the data transfer is reversed. While the resource server's resources are not taxed during this operation, the catalog server's are severely so. When more than 1 thread is used, both the RAM and CPU usage quickly spike to near maximum and the server will crash completely if the transfer is not ended within a short period of time. When using only one thread, the same thing happens, only more slowly. It is also of note that the transfer speed is strongly affected by the resource usage.
So, multiple large file uploads via PRC put() results in high resource usage on the catalog?
And downloads via iget result in high resource usage on the catalog?
Q. What version of iRODS are you running? Q. What OS is iRODS running on? Q. Can you provide hardware specs (RAM and CPU) for your servers? Q. How are you monitoring it? htop or some other tool?
Providing any additional information about your setup would be appreciated.
We want to make sure we can reproduce what you're seeing as accurately as possible.
There was a typo above. I corrected it. During a large PRC put() both catalog and resource servers have normal (< 5% increase in both CPU and RAM) resource usage, but during a large PRC get() the catalog server's resource usage spikes strongly (nearly 100% CPU and RAM/swap) while the resource server's usage remains low. The spike is quicker with more threads and the transfer rate for get() is < 20% that of put() for the same data.
Answers: 4.2.10 CEntOS 7.9 8-core with 8GB RAM Grafana+Prometheus
This test setup is a minimal mirror of the production setup and uses 5 machines: 1 catalog server, 1 ICAT (Postgres), 3 resource servers with 2 volumes each. The resource hierarchy uses replication resources so all data is replicated on 2 of the 3 resource servers.
...]$ ilsresc
rootResc:passthru
└── rootRandy:random
    ├── ptA:passthru
    │   └── replA:replication
    │       ├── randy01:random
    │       │   ├── pt001:passthru
    │       │   │   └── mnt_irodst001:unixfilesystem
    │       │   └── pt011:passthru
    │       └── randy10:random
    │           ├── pt100:passthru
    │           │   └── mnt_irodst100:unixfilesystem
    │           └── pt110:passthru
    ├── ptB:passthru
    │   └── replB:replication
    │       ├── randy00:random
    │       │   ├── pt000:passthru
    │       │   │   └── mnt_irodst000:unixfilesystem
    │       │   └── pt010:passthru
    │       └── randy21:random
    │           ├── pt201:passthru
    │           │   └── mnt_irodst201:unixfilesystem
    │           └── pt211:passthru
    └── ptC:passthru
        └── replC:replication
            ├── randy11:random
            │   ├── pt101:passthru
            │   │   └── mnt_irodst101:unixfilesystem
            │   └── pt111:passthru
            └── randy20:random
                ├── pt200:passthru
                │   └── mnt_irodst200:unixfilesystem
                └── pt210:passthru
The initial PRC version was 1.0.0, but testing with version 1.1.4 shows the same behavior.
Here is a screenshot showing resource usage of the catalog server. The second operation is a get() with only 4 threads to moderate it's impact a bit. Had it been 16 threads, the CPU spike would have been sharper and in any case would have reached 100% had I allowed it, but the server would have been very unhappy about that! It is easy to see the jump in CPU/RAM and dip in throughput for the get() relative the put().
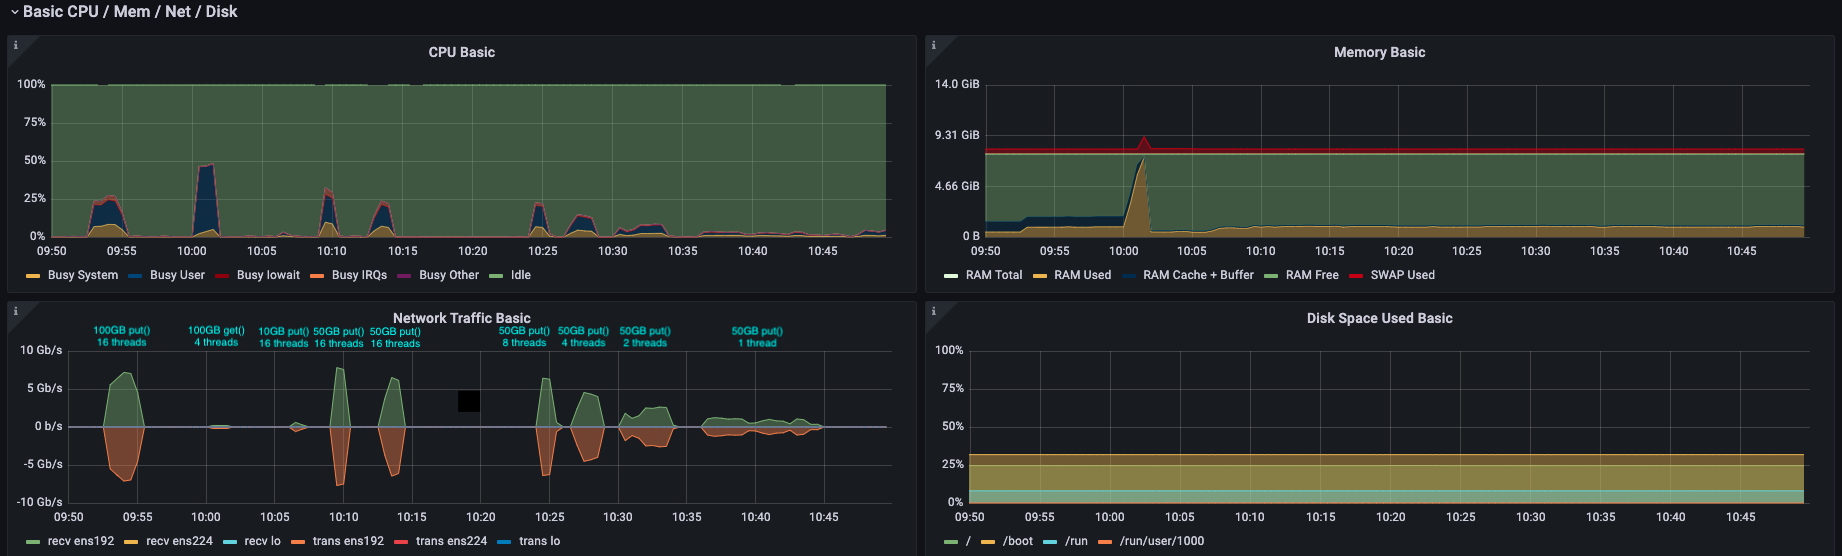
The spike is higher with higher thread count... presumably because they're each making new connections to the server, spinning up independent Agents which are each talking to the catalog and servicing the request?
Is that... sufficiently different than how put() works? An interesting observation, certainly.