Summarize executable entry point contents in tag strings
The empty string here can be populated to pass a string down to the runtime that is picked up by Tracy: https://github.com/google/iree/blob/5c250daec1e6e32ba237b95d47d6d2634a444a87/iree/compiler/Dialect/HAL/Target/LLVM/LLVMAOTTarget.cpp#L218-L220
Information like https://github.com/google/iree/blob/9f17d364db70e3a5429ccf35bd5756af1efe7ed7/iree/hal/local/executable_library_demo.c#L76-L80 would be most useful. Right now it's difficult for developers to map between dispatches in Tracy and what computation ran in those dispatches (that currently involves either looking at the generated code or cross referencing entry point ids with an IR dump).
The call to libraryBuilder.addExport for each entry point happens during executable serialization (after linalg ops have already been lowered to llvm, for example), so a good place to generate a string would be near the top of the translation pass pipeline. A pass could look at what ops each entry point has and summarize them using heuristics. For example, a few linalg named ops could be selected and their main parameters could be encoded into a string. If an entry point has multiple such ops fused together, the strings could be concatenated. Elementwise ops, tensor load ops, etc. could just be skipped over, to avoid generating giant strings.
This (and a similar tagging for a text statistics summary outside of Tracy) could also be useful in comparing IREE's equivalent of -O0 and -O2/-O3. Compiling with no optimizations (mainly fusions in this case) would yield a more traditional "op by op" view that could then be easily compared with the fully optimized settings. Having these sorts of tags would help show which kernels were fused together and how that affects performance.
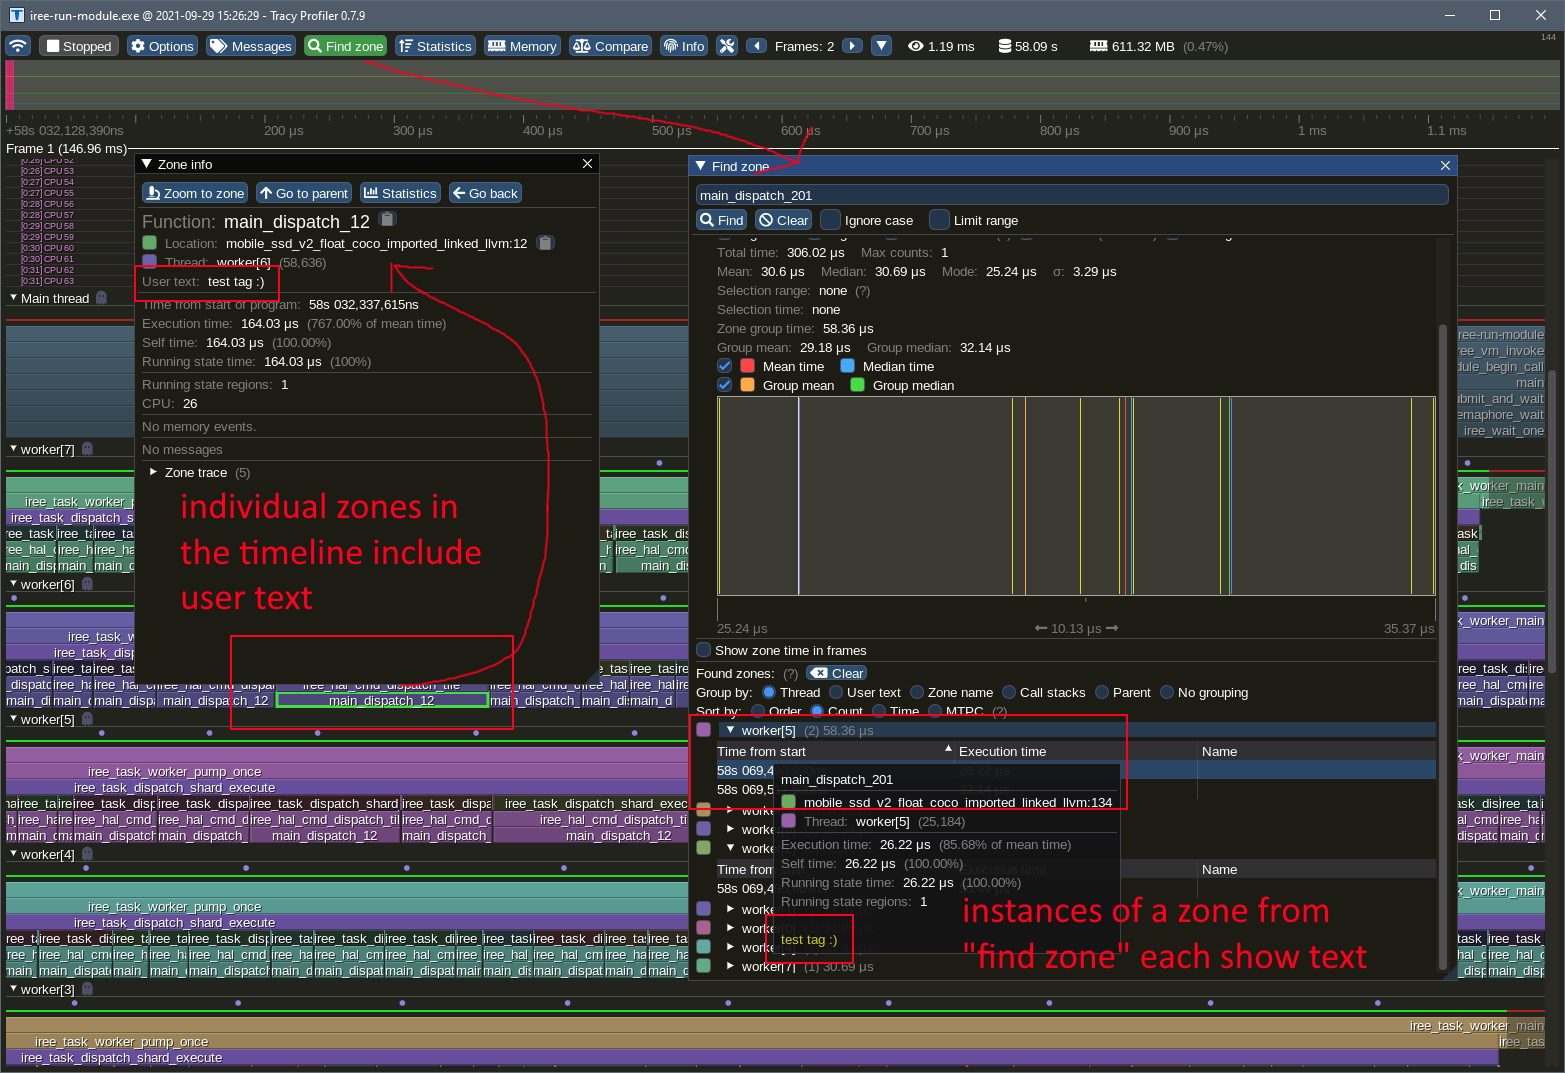
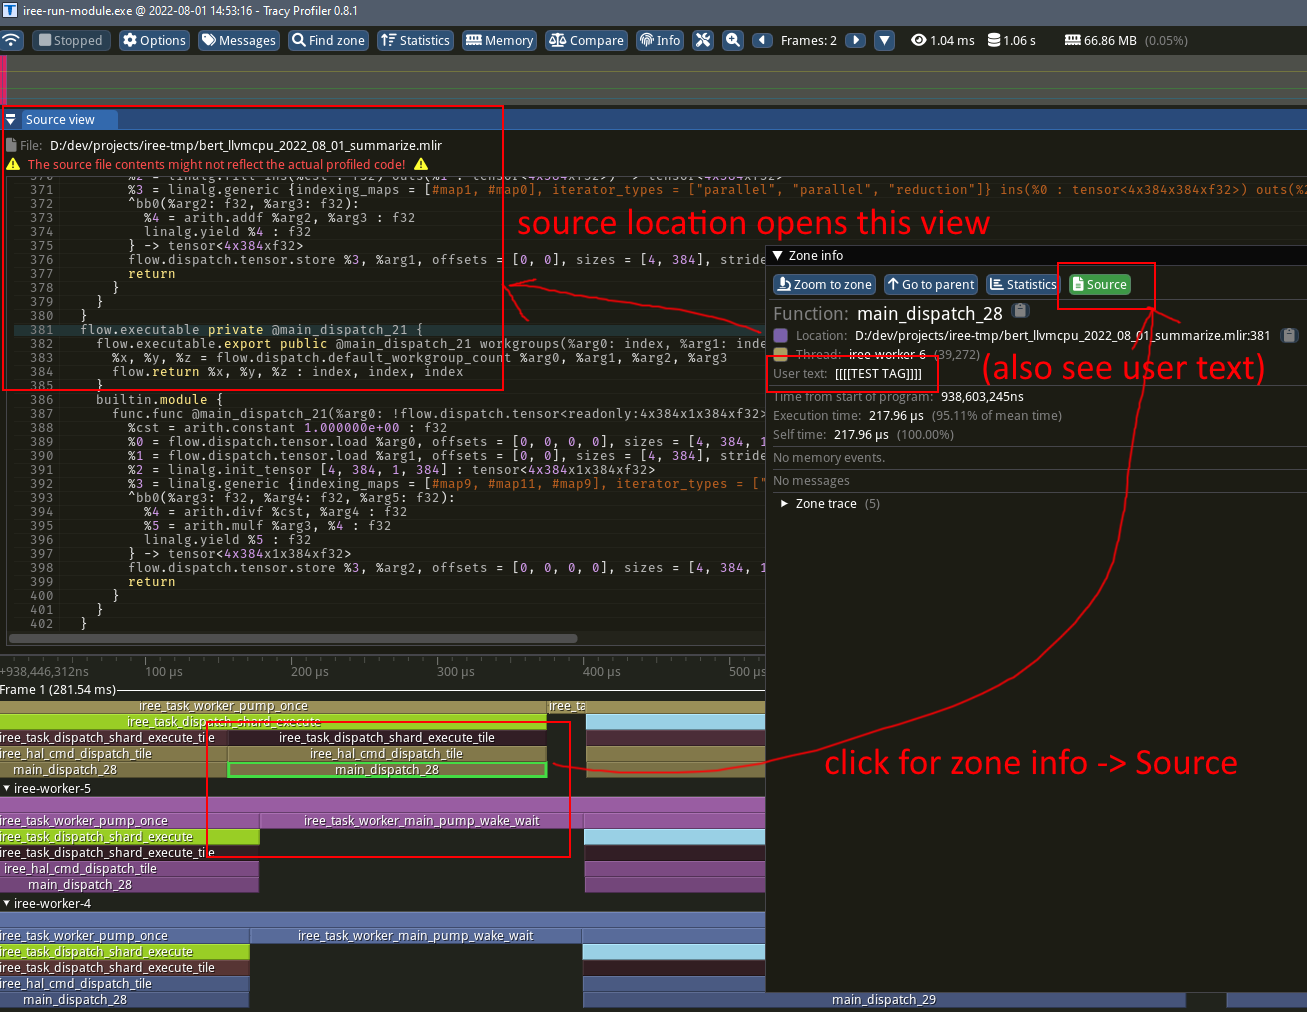
I ran a test with hardcoded tags to see how flexible the UI is and how much we would need to summarize:
if I was debugging a particular issue, having all that context may be helpful over a heuristics-driven summary. For general browsing, a summary might be better.
Ben pointed out that a source location listing will let Tracy resolve to the same thing, even within MLIR, so a summary tag would still be preferred over an entire source string.
yeah the location now is just library name + ordinal, but we can add an optional src_locs table just like we have names/tags here: https://github.com/google/iree/blob/3bcf38ae322e0862d46639b8f6d3580c8d40ac2a/iree/hal/local/executable_library.h#L300
then on the compiler side we can produce whatever we want and add it here: https://github.com/google/iree/blob/3bcf38ae322e0862d46639b8f6d3580c8d40ac2a/iree/compiler/Dialect/HAL/Target/LLVM/LibraryBuilder.cpp#L378
this could be simple file/line, or a range, etc. I haven't looked at how to make tracy happy with it but the other approach would be to embed the full text there and then feed that to tracy as a source file listing - nice thing about that is that it's hermetic, but I think it's fine to have a compiler flag for source listings (so we dump right after dispatch region formation, or after HAL translation, or before HAL serialization, etc - whatever the user wants to see)
(oh tracy does capture and embed source files, so the traces would still be hermetic even with a source listing, it's really just hermetic vmfb vs vmfb+listing file on the capture side)
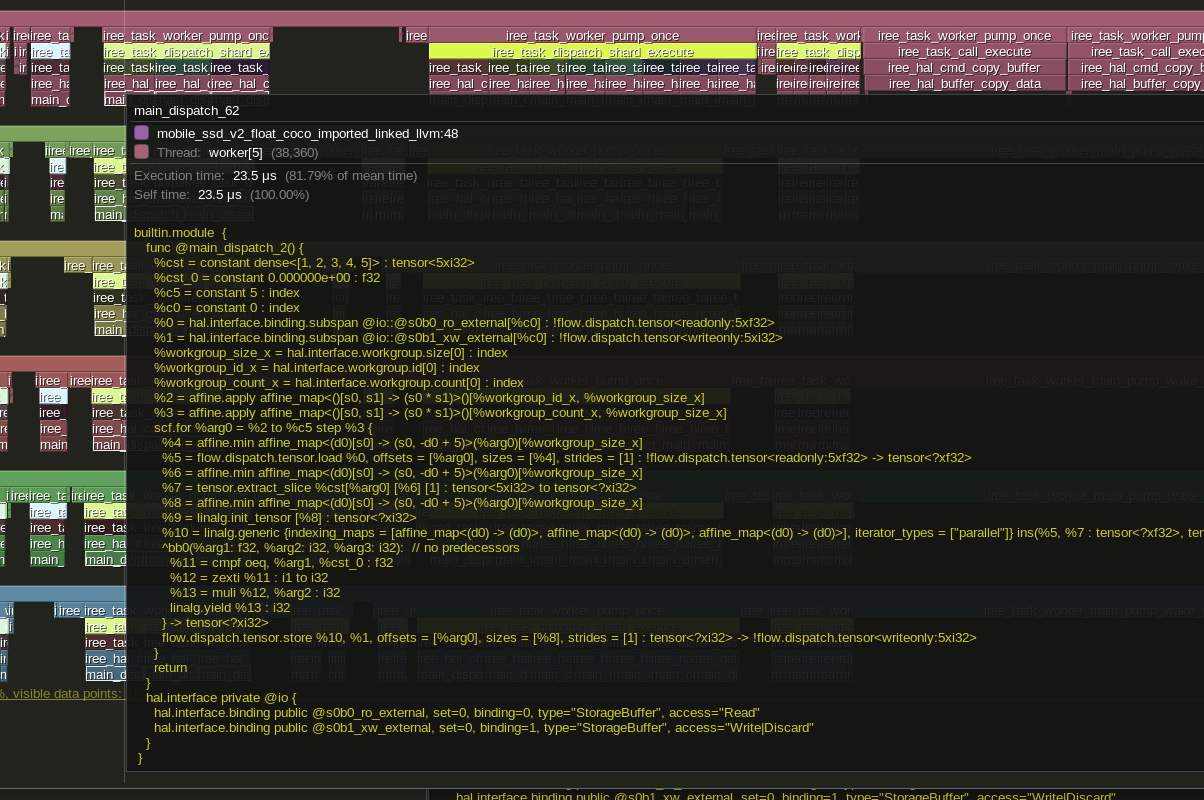
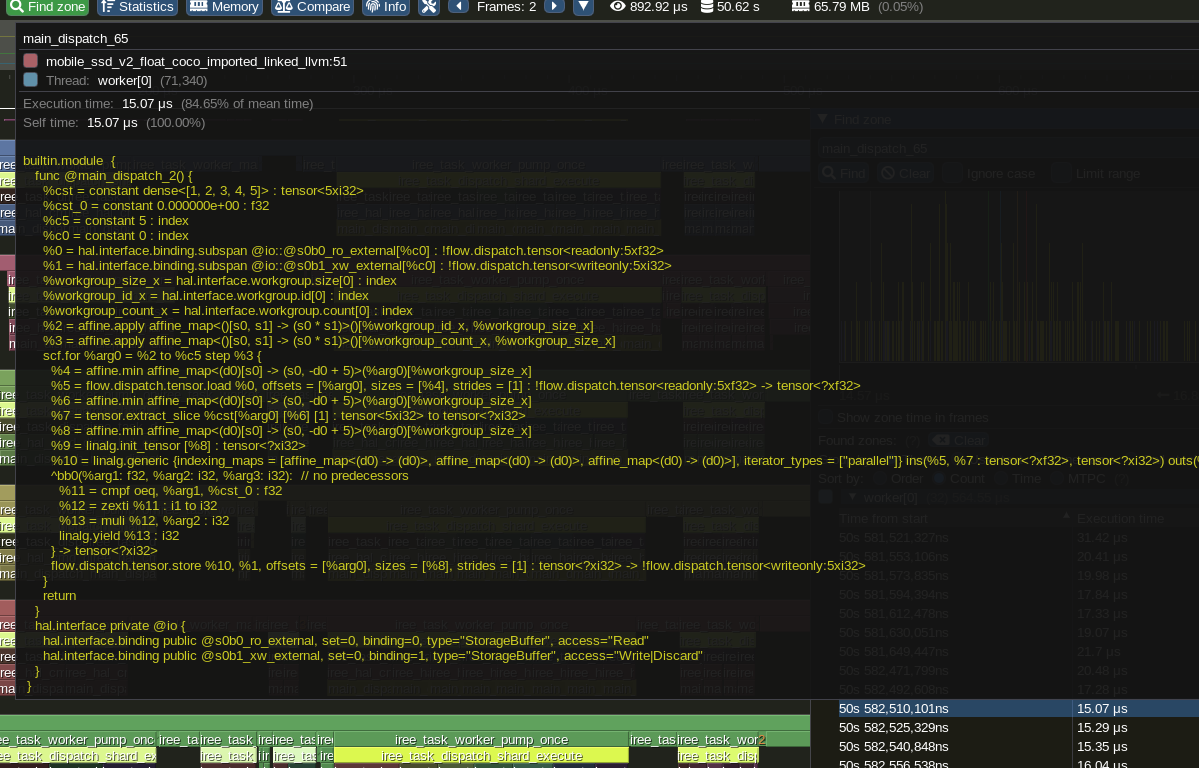
I started working on this, looking at source location listings. To start, I manually dumped .mlir file from --mlir-print-ir-after=iree-flow-deduplicate-executables then hardcoded this block to use the path to that file: https://github.com/iree-org/iree/blob/4c3faac50c486742de6cdc923b2fc8cc859f43d8/runtime/src/iree/hal/local/loaders/embedded_elf_loader.c#L258-L275
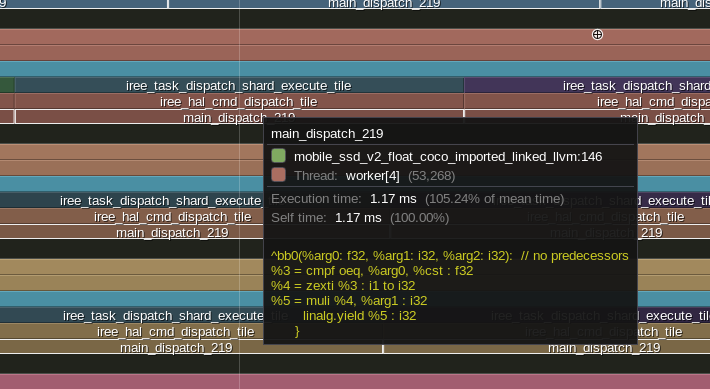
that looks way more useful than the tag user text (though a summary of some sort in there or any args / dynamic dimensions would help). I'll figure out how to not-hardcode it. Might even be able to add a dynamic hook like --iree-source-listing-after=iree-flow-deduplicate-executables (with that as the default?) to let developers pick where they want the source listing to snapshot.
summary tag will be very useful when skimming/looking at the summary view and trying to see what's taking time
stream or untranslated HAL executables would be a good point for the listing capture (so immediately at the start of the HAL dialect before/after interface materialization may be a good place) as we do non-trivial changes during the stream pipeline (materializing builtins, adding/removing args, etc)
we'll want to make sure that we dump the source listing with constants elided or the traces will be big (source gets embedded)
summary tag will be very useful when skimming/looking at the summary view and trying to see what's taking time
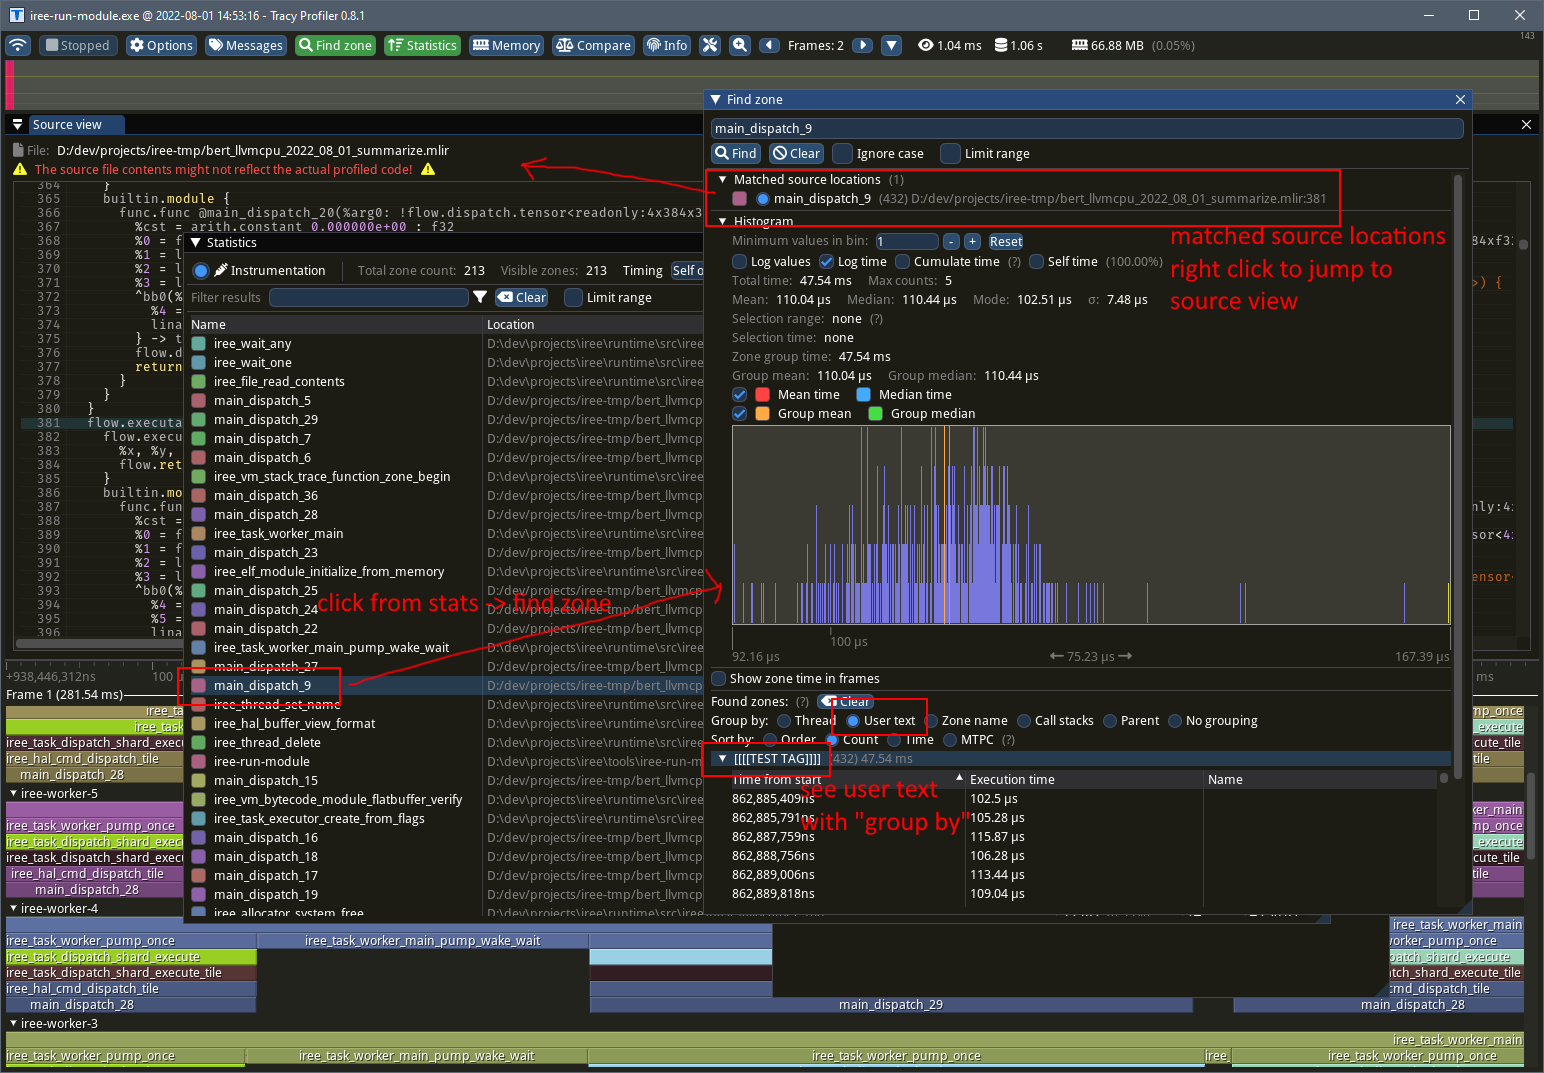
Where would you be looking for that? I only see the user text (tags) in the "group by user text" part of the "find zone" window:
Gotcha. So all together, we could
- use heuristics to name the dispatches
- add dynamic parameters to user text via tags
- add source location listings at one of the stages you mentioned
(I'm looking at 3 now, but if I keep going could work on the other pieces too)
yeah - naming the dispatches in 1 would help all tooling (tracy, perf, our own stuff whenever we have it) as it's the easiest to get universally (it'll end up in dwarf/pdb/spirv symbols and such), while 2 helps tracy, and 3 helps tools that can meaningfully map back to source (tracy, perf, maybe some coverage tools)
love your idea to be able to pick where the source listing is generated as then someone closer to the frontend could do it after import to see their mhlo/tosa and others could do after stream to see linalg and executable translation to see backend-specific (llvm or spirv dialect, etc)