ioBroker.admin
 ioBroker.admin copied to clipboard
Default values for chart/history values not correct
Describe the bug
Logged objects (in my case to sql) where the history data or chart is loaded, have a default value for start point of 1.1.1970 and therefore all data are tried to load. In case there are a huge bunch of logged data, this blocks the Database for some minutes.
To Reproduce
Steps to reproduce the behavior:
- Go to a logged datapoint
- Click on 'User defined settings' and then on Chart
- Check the default values
Expected behavior
Default value should always correct based on the dropdown selection. Furthermore the system should prevent automatically loading data if the time range is > 1 year on loading the GUI
Versions:
- Adapter version: 5.1.25
- JS-Controller version: 3.3.15
- Node version: 14.17.5
- Operating system: linux (docker container)

Ok, but I think you read it wrong! When "Relativ: letzte 30 MIn" is set then only this will be searched and returned. Then Start and end are not used (and are also greyed out.
Only when you select a custom range then these fields are used and you need to specify what you want.
I do not get the issue? Is it about "it is prefilled with 1.1.1970 (because you never set anything there)?
That is understood so far. By now going into details in the code I already found the real issue. Basically the real issue is that on large tables the detection of the range takes very long because of the used query. In my case I have totally 100 million rows in the ts_number where some id's having around 10million rows. So for that we need to have a faster solution. I have checked and found out that following command would be the correct one "select max(ts), min(ts) from ts_number where id = x"
Are maybe just indices on the ts coulums or such missing? ... but then we go more and more to a "sql adapter topic" which is unrelated from admin or?
I guess it is not the sql adapter topic as the request is defined in admin. But lets see, might we need an addition there as well I checked the indices already and these are correct and also used as I can see with the proposed query which takes only 150ms...
@Apollon77 unfortunately i do not have a full development/build environment on my side. Therefore i am even unable to test something on admin as this needs a kind of Build. Is there a way to test my changes i did just to see the difference?
Now comming to my issue: In my case i have large table. If i load then either the chart or the table tab in the object it executes the following selects seen from the sql debug. There it is seen that the first request, which comes from range select command, selects a dataset between 1.1.2000 and now grouped by hours. The next request then clearly selects the data from defined range as expected. See the log for details where the relative range was set to 1h. Just for your information. SQL statements are always logged twice from sql adapter in my case, so if i talk about the second request it is actually the third logged sql statement... iobroker.2021-11-13.log Anyhow, currently i have not understood what the purpose of the first query is and what the effect is if that request would simply removed :(
@nkleber78 your last comment looks like it is not finished. Is this issue still active with admin 5.3.1?
@Feuer-sturm The topic is still there. My suggestion is to remove the select for the whole range as this is potentially taking long (up to some minutes in worst case). Br. Norbert
@nkleber78 Can you please check with Admin 6.x which is in beta repository available?
Admin 6.1.11
Start date and End date will be updated if a value is selected in field "Relativ"
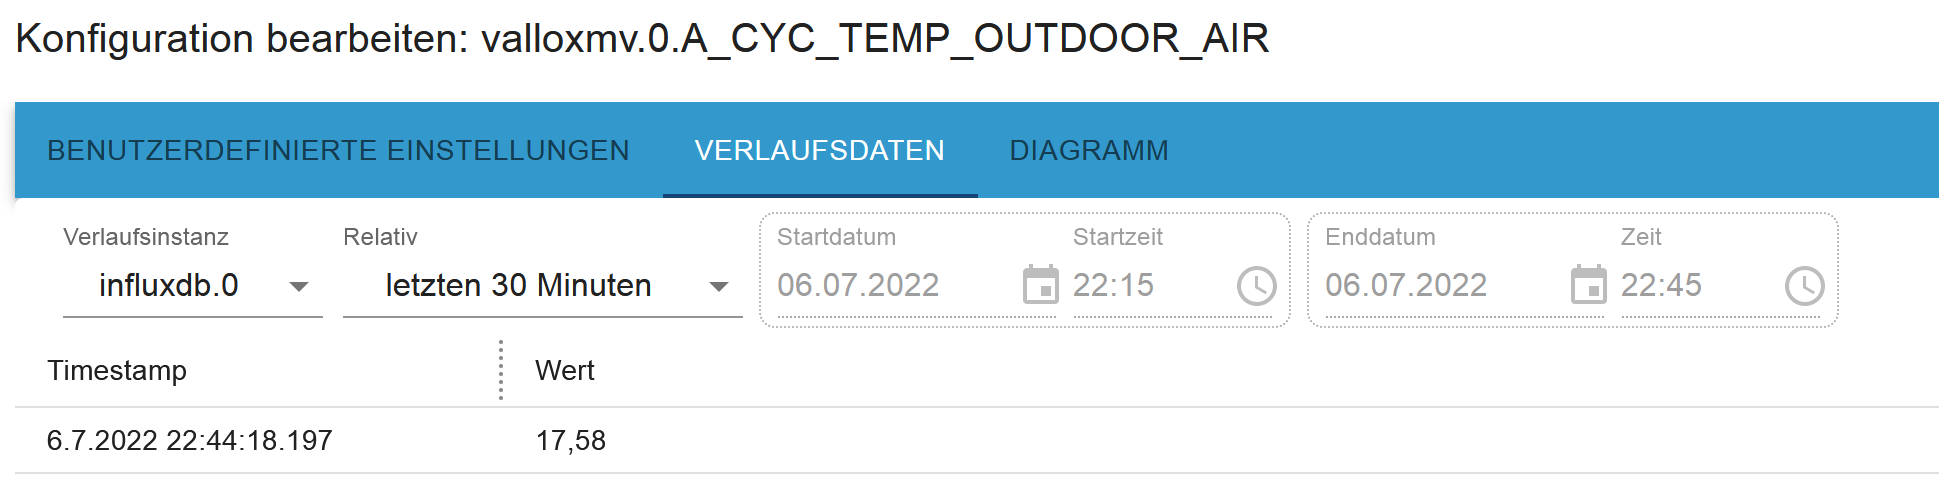
Admin 6.1.11 Start date and End date will be updated if a value is selected in field "Relativ"
Done?
@nkleber78 Do you mean this issue which you mentioned here https://github.com/ioBroker/ioBroker.admin/issues/1174#issuecomment-967865825 ?
Now comming to my issue: In my case i have large table. If i load then either the chart or the table tab in the object it executes the following selects seen from the sql debug. There it is seen that the first request, which comes from range select command, selects a dataset between 1.1.2000 and now grouped by hours.