Feature request: Support for code coverage
Is your feature request related to a problem? Please describe
Compiling SYCL code with options like -fprofile-instr-generate -fcoverage-mapping produces coverage information that cannot be used to produce coverage reports.
For testing purposes, I'm using the trivial example code below and following the instructions from the LLVM documentation.
#include <CL/sycl.hpp>

int main(int argc, char *argv[])
{
  sycl::queue q{sycl::default_selector_v};
  q.single_task([=]() {});
  q.wait();
}
The first three steps complete without errors:
clang++ -o exe -fprofile-instr-generate -fcoverage-mapping -fsycl main.cpp
./exe
llvm-profdata merge -sparse default.profraw -o default.profdata
Attempting to view the coverage information results in errors:
llvm-cov show ./exe -instr-profile=default.profdata

error: /tmp/main-140df3.cpp: No such file or directory
warning: The file '/tmp/main-140df3.cpp' isn't covered.
error: /tmp/main-header-4196d6.h: No such file or directory
warning: The file '/tmp/main-header-4196d6.h' isn't covered.
Exporting the coverage information to JSON shows that some coverage information was collected, but because of indirect mappings via filenames in /tmp/ and the integration header, it's hard to reason about what the coverage information means or whether it is correct:
{"data":[{"files":[{"branches":[],"expansions":[],"filename":"/tmp/main-140df3.cpp","segments":[[5,1,1,true,true,false],[7,23,0,true,true,false],[7,25,1,true,false,false],[9,2,0,false,false,false]],"summary":{"branches":{"count":0,"covered":0,"notcovered":0,"percent":0},"functions":{"count":2,"covered":1,"percent":50},"instantiations":{"count":2,"covered":1,"percent":50},"lines":{"count":6,"covered":5,"percent":83.333333333333343},"regions":{"count":2,"covered":1,"notcovered":1,"percent":50}}},{"branches":[],"expansions":[],"filename":"/tmp/main-header-4196d6.h","segments":[[33,42,3,true,true,false],[33,72,0,false,false,false],[35,44,1,true,true,false],[35,57,0,false,false,false],[37,72,1,true,true,false],[39,4,0,false,false,false],[41,35,1,true,true,false],[41,48,0,false,false,false],[43,46,0,true,true,false],[49,4,0,false,false,false],[51,50,0,true,true,false],[57,4,0,false,false,false],[59,45,0,true,true,false],[65,4,0,false,false,false],[67,47,0,true,true,false],[73,4,0,false,false,false],[76,46,0,true,true,false],[76,59,0,false,false,false]],"summary":{"branches":{"count":0,"covered":0,"notcovered":0,"percent":0},"functions":{"count":9,"covered":4,"percent":44.444444444444443},"instantiations":{"count":9,"covered":4,"percent":44.444444444444443},"lines":{"count":35,"covered":6,"percent":17.142857142857142},"regions":{"count":9,"covered":4,"notcovered":5,"percent":44.444444444444443}}}],"functions":[{"branches":[],"count":1,"filenames":["/tmp/main-140df3.cpp"],"name":"main","regions":[[5,1,9,2,1,0,0,0]]},{"branches":[],"count":3,"filenames":["/tmp/main-header-4196d6.h"],"name":"_ZN4sycl3_V16detail14KernelInfoDataIJLc95ELc90ELc84ELc83ELc90ELc52ELc109ELc97ELc105ELc110ELc69ELc85ELc108ELc118ELc69ELc95EEE7getNameEv","regions":[[33,42,33,72,3,0,0,0]]},{"branches":[],"count":0,"filenames":["/tmp/main-140df3.cpp"],"name":"main.cpp:_ZZ4mainENKUlvE_clEv","regions":[[7,23,7,25,0,0,0,0]]},{"branches":[],"count":1,"filenames":["/tmp/main-header-4196d6.h"],"name":"_ZN4sycl3_V16detail14KernelInfoDataIJLc95ELc90ELc84ELc83ELc90ELc52ELc109ELc97ELc105ELc110ELc69ELc85ELc108ELc118ELc69ELc95EEE12getNumParamsEv","regions":[[35,44,35,57,1,0,0,0]]},{"branches":[],"count":1,"filenames":["/tmp/main-header-4196d6.h"],"name":"_ZN4sycl3_V16detail14KernelInfoDataIJLc95ELc90ELc84ELc83ELc90ELc52ELc109ELc97ELc105ELc110ELc69ELc85ELc108ELc118ELc69ELc95EEE12getParamDescEj","regions":[[37,72,39,4,1,0,0,0]]},{"branches":[],"count":1,"filenames":["/tmp/main-header-4196d6.h"],"name":"_ZN4sycl3_V16detail14KernelInfoDataIJLc95ELc90ELc84ELc83ELc90ELc52ELc109ELc97ELc105ELc110ELc69ELc85ELc108ELc118ELc69ELc95EEE7isESIMDEv","regions":[[41,35,41,48,1,0,0,0]]},{"branches":[],"count":0,"filenames":["/tmp/main-header-4196d6.h"],"name":"_ZN4sycl3_V16detail14KernelInfoDataIJLc95ELc90ELc84ELc83ELc90ELc52ELc109ELc97ELc105ELc110ELc69ELc85ELc108ELc118ELc69ELc95EEE11getFileNameEv","regions":[[43,46,49,4,0,0,0,0]]},{"branches":[],"count":0,"filenames":["/tmp/main-header-4196d6.h"],"name":"_ZN4sycl3_V16detail14KernelInfoDataIJLc95ELc90ELc84ELc83ELc90ELc52ELc109ELc97ELc105ELc110ELc69ELc85ELc108ELc118ELc69ELc95EEE15getFunctionNameEv","regions":[[51,50,57,4,0,0,0,0]]},{"branches":[],"count":0,"filenames":["/tmp/main-header-4196d6.h"],"name":"_ZN4sycl3_V16detail14KernelInfoDataIJLc95ELc90ELc84ELc83ELc90ELc52ELc109ELc97ELc105ELc110ELc69ELc85ELc108ELc118ELc69ELc95EEE13getLineNumberEv","regions":[[59,45,65,4,0,0,0,0]]},{"branches":[],"count":0,"filenames":["/tmp/main-header-4196d6.h"],"name":"_ZN4sycl3_V16detail14KernelInfoDataIJLc95ELc90ELc84ELc83ELc90ELc52ELc109ELc97ELc105ELc110ELc69ELc85ELc108ELc118ELc69ELc95EEE15getColumnNumberEv","regions":[[67,47,73,4,0,0,0,0]]},{"branches":[],"count":0,"filenames":["/tmp/main-header-4196d6.h"],"name":"_ZN4sycl3_V16detail14KernelInfoDataIJLc95ELc90ELc84ELc83ELc90ELc52ELc109ELc97ELc105ELc110ELc69ELc85ELc108ELc118ELc69ELc95EEE13getKernelSizeEv","regions":[[76,46,76,59,0,0,0,0]]}],"totals":{"branches":{"count":0,"covered":0,"notcovered":0,"percent":0},"functions":{"count":11,"covered":5,"percent":45.454545454545453},"instantiations":{"count":11,"covered":5,"percent":45.454545454545453},"lines":{"count":41,"covered":11,"percent":26.829268292682929},"regions":{"count":11,"covered":5,"notcovered":6,"percent":45.454545454545453}}}],"type":"llvm.coverage.json.export","version":"2.0.1"}
Describe the solution you would like I don't know enough about how coverage is implemented in LLVM to know how difficult it would be to fully support this feature. I would be happy to see incremental improvements:
- The workflow above completes without errors and gives meaningful information for host code.
- Coverage information reflects the number of times each kernel was called (but without per-line information inside of device code).
- Coverage information reflects the number of times each line was executed in device code.
Describe alternatives you have considered I haven't considered any other alternatives. I'd like to use LLVM's code coverage features, if possible.
Additional context Support for this functionality would enable experiments in https://github.com/intel/code-base-investigator to support dynamic and coverage-based code divergence calculations.
Hi @Pennycook,
My understanding is that we should have code coverage support which comes from the upstream LLVM, but it will only be enabled for host part of the program. My guess is that results you see are screwed by our integration footer and not integration header. Could you please try your example with -fno-sycl-use-footer to see if it produces better results?
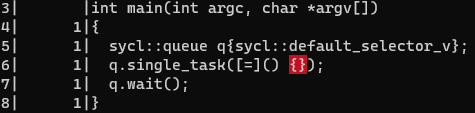
Thanks for looking at this, @AlexeySachkov. -fno-sycl-use-footer helps a little bit, but still produces some errors.
llvm-cov show ./exe -instr-profile=default.profdata
main.cpp:
    1|       |#include <CL/sycl.hpp>
    2|       |
    3|       |int main(int argc, char *argv[])
    4|      1|{
    5|      1|  sycl::queue q{sycl::default_selector_v};
    6|      1|  q.single_task([=]() {});
    7|      1|  q.wait();
    8|      1|}

error: /tmp/main-header-295c8a.h: No such file or directory
warning: The file '/tmp/main-header-295c8a.h' isn't covered.
(It doesn't show in the snippet, but the coverage also identifies the empty lambda body ({}) as being unexecuted. The 1 associated with Line 5 is because of the call to q.single_task).
Am I right in thinking that the integration footer is currently required to implement some features (like specialization constants)? It would be nice if these coverage features were compatible with all SYCL features.
error: /tmp/main-header-295c8a.h: No such file or directory
warning: The file '/tmp/main-header-295c8a.h' isn't covered.
This now points to integration header which is also only exists temporary during compilation.
Am I right in thinking that the integration footer is currently required to implement some features (like specialization constants)?
Right, currently specialization constants and device global features require integration footer presence.
It doesn't show in the snippet, but the coverage also identifies the empty lambda body ({}) as being unexecuted
That's interesting. If I understand correctly, we shouldn't invoke the kernel lambda at host at all.
That's interesting. If I understand correctly, we shouldn't invoke the kernel lambda at host at all.
Sorry, that's what I meant -- the empty lambda body is not executed. The real terminal output is highlighted to show that the "1" in the first column only applies to part of the line:
So, looking at my original 3 requests, I think we're actually already quite close to the first two... We'd get meaningful information for host code if the integration header/footer stuff could be made compatible with the coverage format. And with some post-processing we could work out how many times each kernel is called based on the host-side information.
BTW, I've just realized that if you try to compile with --save-temps, then perhaps you should be able to see no errors with both integration footer and header. But I still wouldn't recommend to enable the footer, because it will replace the main file
BTW, I've just realized that if you try to compile with
--save-temps, then perhaps you should be able to see no errors with both integration footer and header. But I still wouldn't recommend to enable the footer, because it will replace the main file
The behavior here is really interesting.
Compiling with --save-temps does cause the errors to go away, both with and without the footer. But in both cases, the coverage report now references a fully preprocessed version of the file. So, instead of the expected 8 lines of output, I get 12985!
Hi @Pennycook
I also tried --save-temps and looked at the report. The report is huge. But the expected 8 lines are at the very end of the report and can be easily identified and/or parsed. Will that be sufficient for your purposes?
Thanks
I also tried --save-temps and looked at the report. The report is huge. But the expected 8 lines are at the very end of the report and can be easily identified and/or parsed. Will that be sufficient for your purposes?
Having to write code to identify the correct lines and parse them is a bit of a headache, and it breaks the illusion that we're just collecting coverage for a regular C++ program. I can try, but my focus is on other projects right now.
The --save-temps solution also doesn't address my point (3.) about enabling device-side coverage. My suggested workaround for that would reduce the accuracy of the results, and I don't think it's possible to get an accurate result without compiler assistance.