Potential memory leak in `hs_compile` and `hs_compile_multi`
Hi, I found a potential memory leak issue in both hs_compile and hs_compile_multi.
A toy example C++ code generating DFA on top of 1000 regexes for multiple rounds (2000 rounds each) shows increasing memory usage.
#include <cstdio>
#include <cstdlib>
#include <cstring>
#include <vector>
#include <string>
#include <hs.h>
#include <hs_common.h>
#include <unistd.h>

using namespace std;

const unsigned FLAG = HS_FLAG_CASELESS | HS_FLAG_ALLOWEMPTY;
const int LIMIT = 1000;

vector<string> readPatternsFromFile() {
    FILE *pfile = fopen("regex.txt", "r");
    char in[1010];
    vector<string> patterns;
    int cnt = 0;
    while (fgets(in, 1000, pfile) != NULL and cnt < LIMIT)
    {
        in[strlen(in) - 1] = 0;
        patterns.push_back(in);
        cnt += 1;
    }
    fclose(pfile);
    return patterns;
}

vector<string> validateRegexes(
    vector<string>& untested_patterns
) {
    vector<string> valid_patterns;
    for (auto& untested_pattern : untested_patterns){
            hs_database_t *db;
            hs_compile_error_t *compileErr;
            if (hs_compile(untested_pattern.c_str(), FLAG, HS_MODE_BLOCK, NULL, &db, &compileErr) == HS_SUCCESS) {
            valid_patterns.push_back(untested_pattern);
        } else {
            //fprintf(stderr, "ERROR: Unable to compile pattern \"%s\": %s\n", untested_pattern.c_str(), compileErr->message);
        }
        hs_free_compile_error(compileErr);
        hs_free_database(db);
    }
    return valid_patterns;
}

hs_database_t *buildDatabase(vector<string>& valid_patterns) {
    vector<const char *> expressions;
    vector<unsigned> flags;
    vector<unsigned> ids;
    for (size_t idx = 0; idx < valid_patterns.size(); idx += 1) {
        expressions.push_back(valid_patterns[idx].c_str());
        flags.push_back(FLAG);
        ids.push_back(idx);
    }

    hs_database_t *db;
    hs_compile_error_t *compileErr;
    assert(hs_compile_multi(&expressions[0], &flags[0], &ids[0], valid_patterns.size(), HS_MODE_BLOCK, NULL, &db, &compileErr) == 0);
    hs_free_compile_error(compileErr);
    return db;
}

int onMatch(unsigned int id, unsigned long long from, unsigned long long to, unsigned int flags, void *ctx) {
    // Our context points to a size_t storing the match count
    size_t *matches = (size_t *)ctx;
    (*matches)++;
    return 0; // continue matching
}

int main()
{
    vector<string> untested_patterns = readPatternsFromFile();
    vector<string> valid_patterns;
    for (int idx = 0; idx < 2000; idx += 1)
    {
        valid_patterns = validateRegexes(untested_patterns);
        if (idx % 10 == 0) {
            printf("Now is at %d\n", idx);
        }
    }

    for (int idx = 0; idx < 2000; idx += 1){
        hs_database_t *db_block = buildDatabase(valid_patterns);
        if (idx % 10 == 0) {
            printf("Now is at %d\n", idx);
        }
        hs_free_database(db_block);
    }
    hs_database_t *db_block = buildDatabase(valid_patterns);

    string text = "fxck";
    hs_scratch_t *scratch(nullptr);
    assert(hs_alloc_scratch(db_block, &scratch) == 0);

    for (int idx = 0; idx < 1000; idx += 1) {
        size_t matchCount = 0;
        assert(hs_scan(db_block, text.c_str(), text.length(), 0, scratch, onMatch, &matchCount) == 0);
        if (idx % 1000 == 0) {
            printf("%d: Matched %u\n", idx, (unsigned int)matchCount);
            sleep(1);
        }
    }
}
After running this toy C++ example, runner.cpp, I used psrecord $(pgrep -f 'runner') --interval 1 --plot runner.png to capture the CPU and MEM usages on my local machine, which is shown as follows.
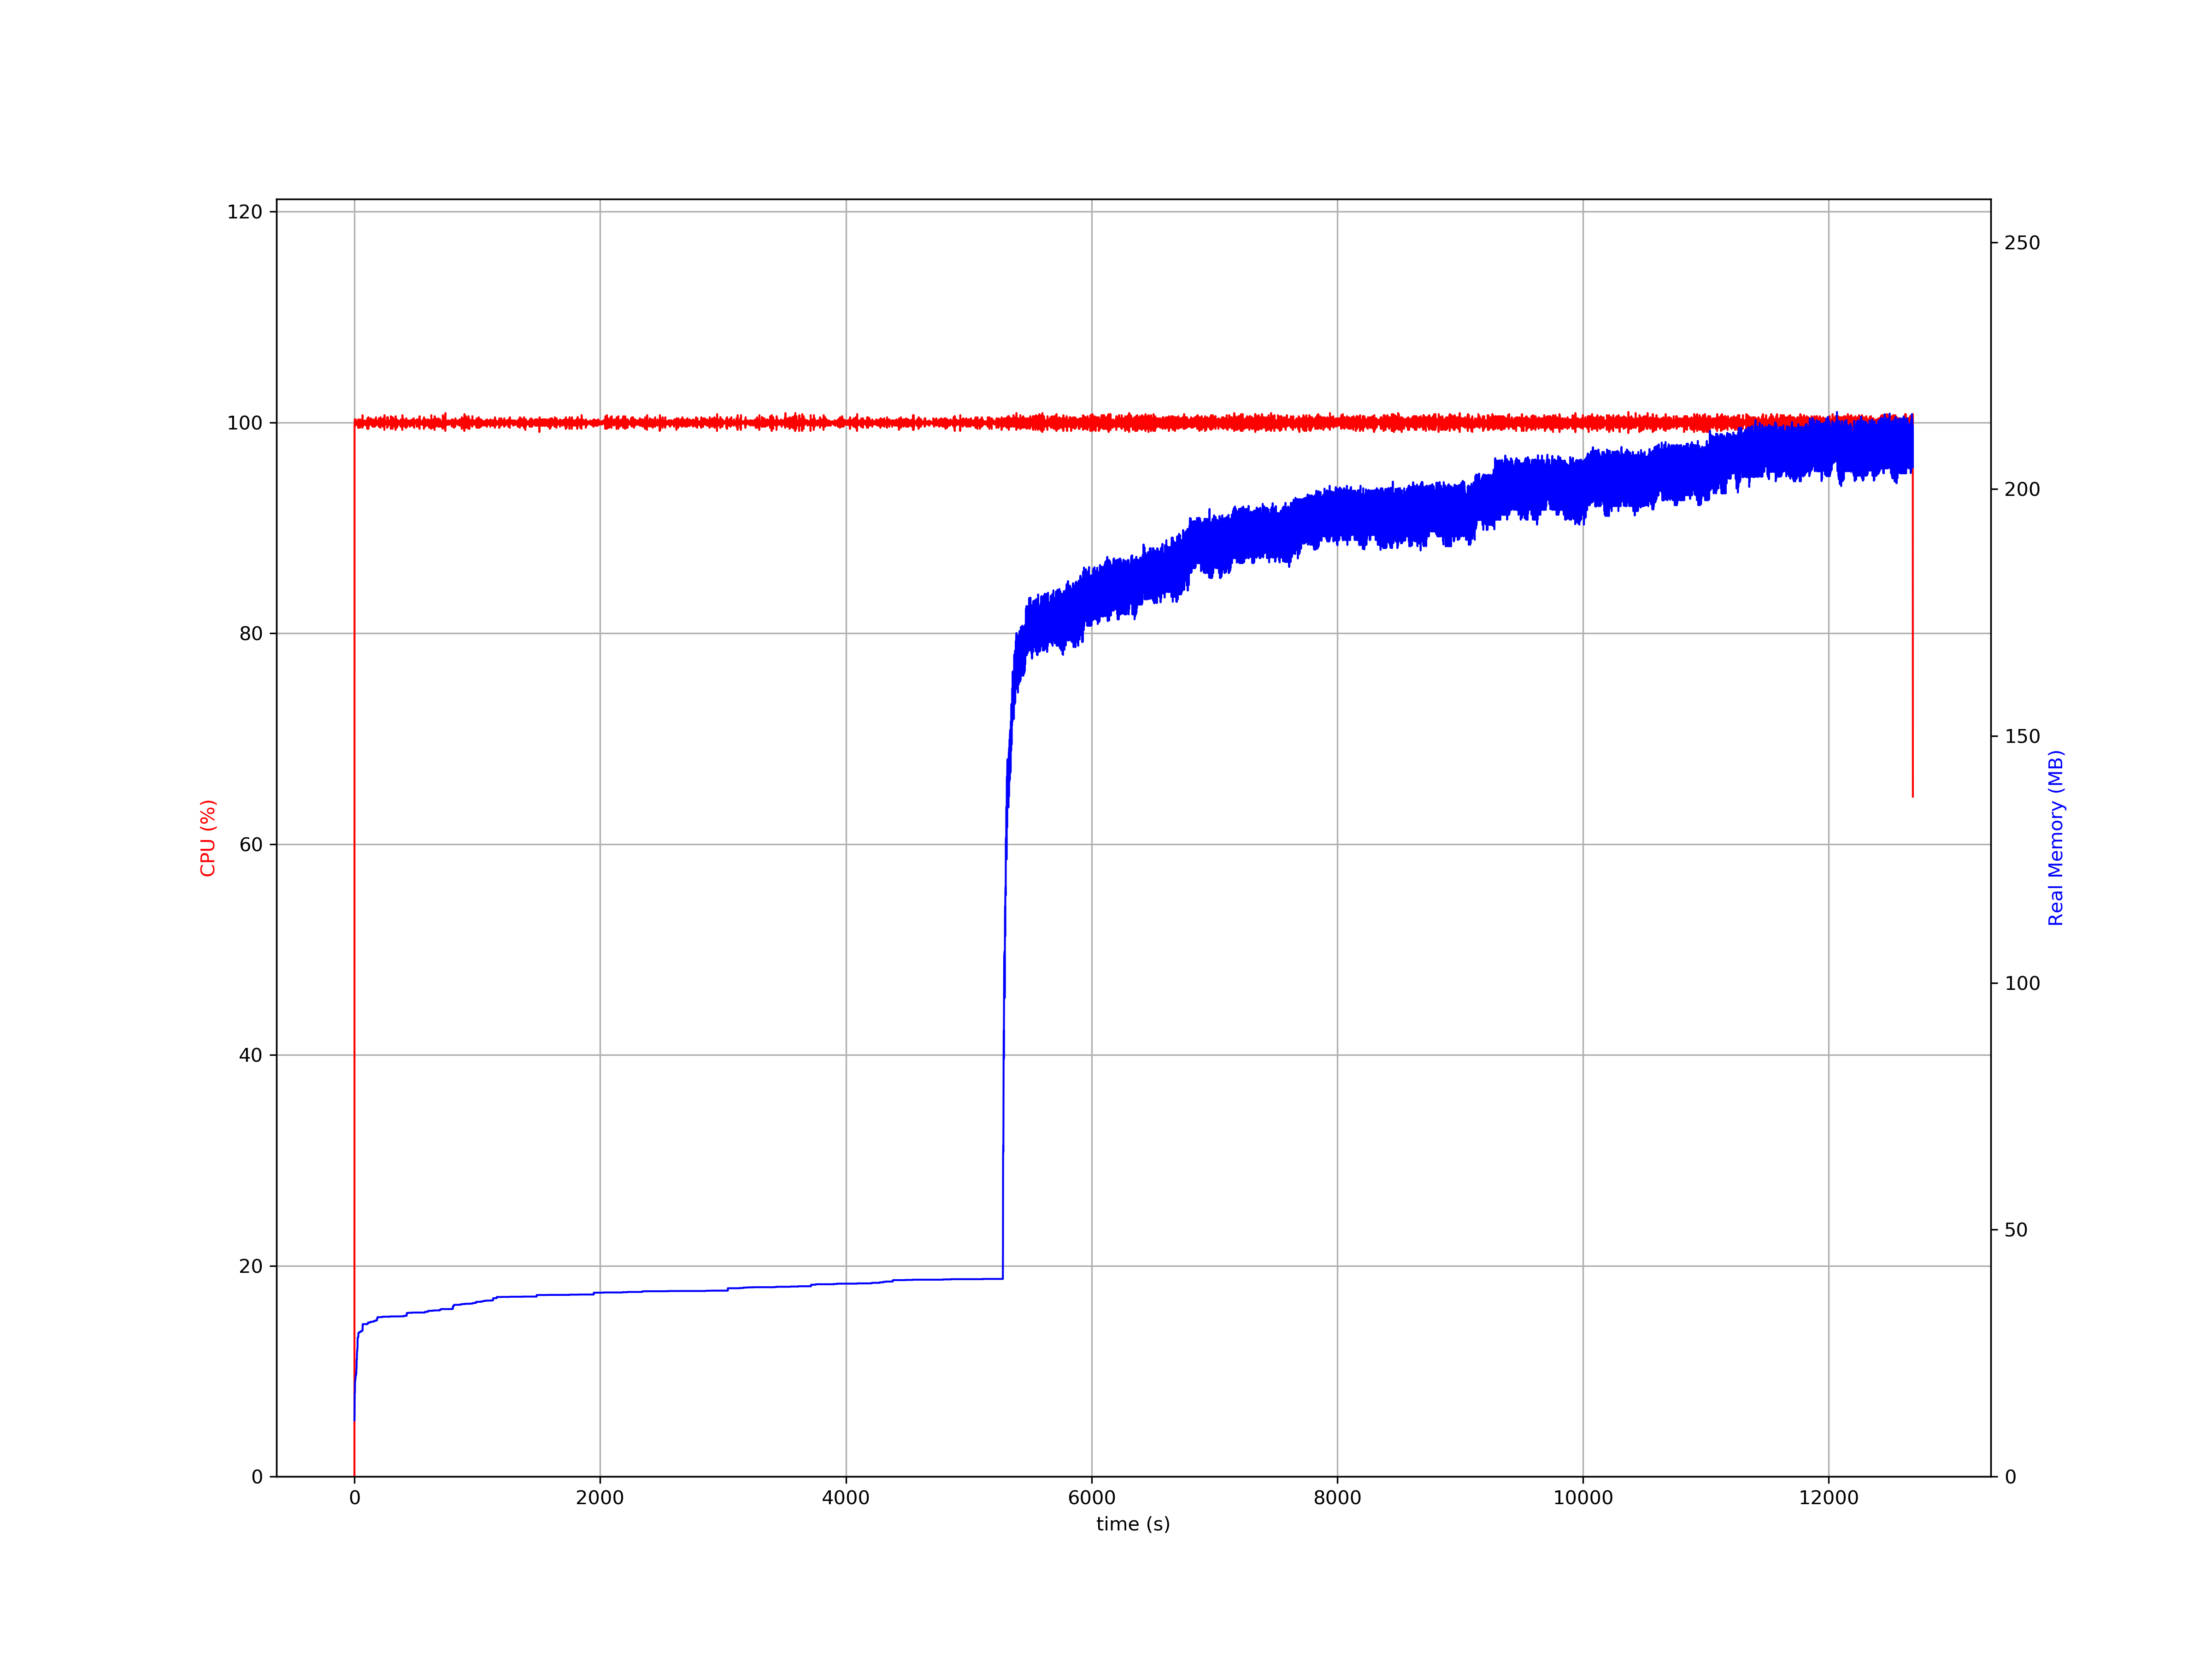
I believe I have already freed up all the allocated memory by calling both hs_free_compile_error and hs_free_database and should not be seeing memory increase over time. Can someone shed some light on this?
How long does it take to finish one call to hs_compile and hs_compile_multi? How long does this total program take? What kind of regex are you using in your test?
Hi @xiangwang1, you can see the used time for each step at the x-axis: it is about 2.6s for hs_compile, 3.7 s for hs_compile_multi, and overall 13000s for the whole program execution.
Sorry that I am not able to share the regexes here, but there do exist some regexes that Hyperscan cannot deal with within the first 1000 regexes, such as lookahead and lookbehind. That’s the reason why we decided to do it in two steps in this toy example: 1) use hs_compile to find out regexes that can be compiled by Hyperscan successfully and then 2) use hs_comiple_multi to create the final DFA on top of all valid regexes.
Most of the regexes are something like (a|b|c)+, (a|b|c){1,10}, or some combinations, whose lengths are less than 100 characters.
Please let me know if you need further information! Thanks!
@hogansung, I think system memory consumption isn't only about the size of database you generated, but is also highly dependent on your program and calling functions such as hs_compile and hs_compile_multi which does complex graph analysis and can consume up to several hundred MB of memory.
It'll be better to use valgrind to detect memory leak issues.
@xiangwang1 Sorry for my late reply. I totally understand there might be many intermediate memory usages while analyzing regexes or building DFAs inside hs_compile and hs_compile_multi. However, that doesn't explain why the memory keeps piling up itself after thousands of for loops?
I haven't used any modern memory leak detection tool before, but I will try to learn valgrind and get back to you if I have any new findings!
I am having the same problem. The interesting thing is, on Ubuntu 14, X86-64, hyperscan (5.2.0 - 5.3.0) does NOT have any memory leak. However, on Ubuntu 18 X86-64, all these versions suffer from this bug.
I used Valgrind to check it, however, no memory leak was detected. Here is the summary:
==12582== ==12582== HEAP SUMMARY: ==12582== in use at exit: 3,364 bytes in 4 blocks ==12582== total heap usage: 954,710,173 allocs, 954,710,169 frees, 217,275,028,511 bytes allocated ==12582== ==12582== Searching for pointers to 4 not-freed blocks ==12582== Checked 199,784 bytes ==12582== ==12582== LEAK SUMMARY: ==12582== definitely lost: 0 bytes in 0 blocks ==12582== indirectly lost: 0 bytes in 0 blocks ==12582== possibly lost: 0 bytes in 0 blocks ==12582== still reachable: 3,364 bytes in 4 blocks ==12582== suppressed: 0 bytes in 0 blocks ==12582== Reachable blocks (those to which a pointer was found) are not shown. ==12582== To see them, rerun with: --leak-check=full --show-leak-kinds=all ==12582== ==12582== ERROR SUMMARY: 0 errors from 0 contexts (suppressed: 0 from 0) ==12582== ERROR SUMMARY: 0 errors from 0 contexts (suppressed: 0 from 0)
We also ran Valgrind internally to avoid memory leak issues. So I think this could not be an issue with Hyperscan itself.
We also ran Valgrind internally to avoid memory leak issues. So I think this could not be an issue with Hyperscan itself.
This is definitely related to operating Systems. As I said, I have run the exact code on both Ubuntu 18 and Ubuntu 14 with the same version of hyperscan. On Ubuntu 14, everything is OK. But on 18, the process does not release the memory at all.
@xiangwang1 More update. I found a temporary solution to this problem. After calling hs_compile_multi(), a call to malloc_trim(0) can significantly reduce the physical memory of the process (the size of the virtual memory is not changed). I played around with malloc configurations, but none of my tests solves the problem. So I guess there must be changes in the kernel.