Proxmox Input Plugin exposes useless fields
Feature Request
The Proxmox Input Plugin exposes, among others, the following fields:
- disk_used
- disk_total
- disk_free
- disk_used_percentage
It exposes these for every VM running on Proxmox.
The issue is, Proxmox has no idea about disk usage of each VM, because without visibility into the running VM, Proxmox just see's the VM's disk file.
Proposal:
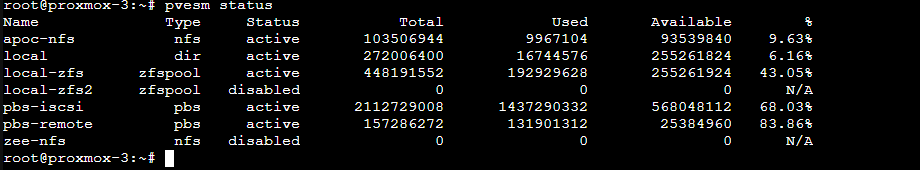
Report on the Proxmox host storage pool disk stats instead. Proxmox exposes these easily with the pvesm status command.
Current behavior:
The current behaviour gives completely meaningless values for the above metrics. Mostly it just reports back the size of the VM disk image (e.g. raw file size).
Desired behavior:
Ditch the above metrics and replace with Proxmox storage pool stats, e.g. these:
Use case:
I'd like to monitor the storage pool space in Proxmox! This goes for the entire plugin actually, I'd like to monitor Proxmox host stats not just individual VM's running in Proxmox.
@timdonovanuk,
Thanks for the feature request. I like the idea and think we should be monitoring the disk pools over the VM disks themselves. The plugin currently uses HTTP requests to the proxmox API. It sounds like we could maybe look at the "pools" API. Do you have any pointers to those details?
next steps: explore which API we can pull the data from, and then parse it out and create new metrics like pool_$name_used pool_$name_total pool_$name_free?
Thanks!
Hey @powersj thanks for considering it :)
Please also consider exposing the used_fraction metric - it's not always easy to do maths functions on the data collection endpoint to get a % free (InfluxQL I'm looking at you!)
API docs: https://pve.proxmox.com/pve-docs/api-viewer/index.html#/nodes/{node}/storage
The storage for each Proxmox Node can be obtained through API like this:
First:
https://proxmox-server:8006/api2/json/nodes
This retrieves a list of Proxmox nodes and will need to enumerate over the id field and call:
https://proxmox-server:8006/api2/json/nodes/{node-id}/storage
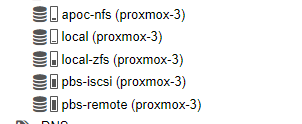
This returns something such as below (this corresponds to my screenshot in original comment):
{
   "data":[
      {
         "content":"iso,backup,vztmpl,snippets",
         "enabled":1,
         "avail":95784796160,
         "shared":1,
         "used_fraction":0.0962940611984448,
         "type":"nfs",
         "used":10206314496,
         "storage":"apoc-nfs",
         "active":1,
         "total":105991110656
      },
      {
         "content":"snippets,rootdir,vztmpl",
         "enabled":1,
         "used_fraction":0.0330535232861345,
         "shared":0,
         "avail":782680326144,
         "type":"dir",
         "storage":"local",
         "used":26754678784,
         "total":809435004928,
         "active":1
      },
      {
         "avail":539017814016,
         "shared":1,
         "used_fraction":0.700020615232638,
         "enabled":1,
         "content":"backup",
         "active":1,
         "total":2163434504192,
         "used":1514448752640,
         "storage":"pbs-iscsi",
         "type":"pbs"
      },
      {
         "type":"pbs",
         "used":161061273600,
         "storage":"pbs-remote",
         "active":1,
         "total":161061273600,
         "content":"backup",
         "enabled":1,
         "avail":0,
         "used_fraction":1,
         "shared":1
      },
      {
         "storage":"local-zfs",
         "used":155689693184,
         "type":"zfspool",
         "total":938370142208,
         "active":1,
         "content":"images,rootdir",
         "shared":0,
         "used_fraction":0.165915011764611,
         "avail":782680449024,
         "enabled":1
      },
      {
         "content":"iso",
         "enabled":0,
         "shared":1,
         "avail":0,
         "type":"nfs",
         "storage":"zee-nfs",
         "used":0,
         "total":0,
         "active":0
      },
      {
         "storage":"local-zfs2",
         "used":819786391552,
         "type":"zfspool",
         "active":1,
         "total":1931124670464,
         "content":"rootdir,images",
         "used_fraction":0.424512411907112,
         "shared":0,
         "avail":1111338278912,
         "enabled":1
      }
   ]
}