kapacitor
 kapacitor copied to clipboard
memory leak related to task using join node
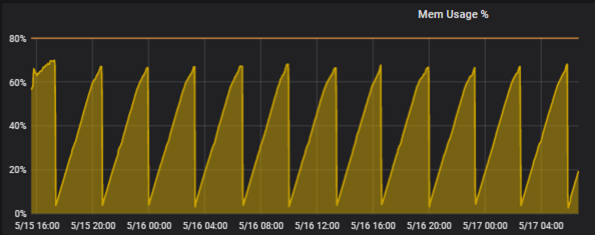
We are observing a consistent memory leak in Kapacitor. We were running several different types of Tasks, but we isolated the problem down to a single task that uses a Join node. Kapacitor's memory usage continues to grow until the OOM killer targets it and restarts the process (in our case, this restarts the docker container). This pattern repeats itself continuously. The following is a snapshot of the memory usage displayed in Grafana:
The following are two pprof snapshots showing the top 10 memory uses over a ~20 minute period. During this period the number of data series is constant (there is no change in the number of measurements, tags or tag values).
legacy@XXX:~/$ go tool pprof http://localhost:9992/kapacitor/v1/debug/pprof/heap
Fetching profile over HTTP from http://localhost:9992/kapacitor/v1/debug/pprof/heap
Saved profile in /Users/legacy/pprof/pprof.kapacitord.alloc_objects.alloc_space.inuse_objects.inuse_space.032.pb.gz
File: kapacitord
Type: inuse_space
Time: May 22, 2020 at 8:18am (EDT)
Entering interactive mode (type "help" for commands, "o" for options)
(pprof) top
Showing nodes accounting for 36.55MB, 86.81% of 42.10MB total
Showing top 10 nodes out of 126
      flat  flat%   sum%        cum   cum%
    8.50MB 20.20% 20.20%     8.50MB 20.20%  github.com/influxdata/kapacitor/vendor/github.com/influxdata/influxdb/models.Tags.Map
    7.50MB 17.82% 38.01%     7.50MB 17.82%  github.com/influxdata/kapacitor.newJoinset
    6.50MB 15.44% 53.46%     6.50MB 15.44%  github.com/influxdata/kapacitor/vendor/github.com/influxdata/influxdb/models.(*point).unmarshalBinary
    4.50MB 10.69% 64.15%     4.50MB 10.69%  strings.(*Builder).WriteString
    2.50MB  5.94% 70.09%     2.50MB  5.94%  github.com/influxdata/kapacitor/edge.(*pointMessage).ShallowCopy
    2.01MB  4.78% 74.87%     9.51MB 22.60%  github.com/influxdata/kapacitor.(*joinGroup).Collect
    1.52MB  3.62% 78.49%     1.52MB  3.62%  github.com/influxdata/kapacitor/edge.NewChannelEdge
    1.50MB  3.56% 82.05%     2.50MB  5.94%  github.com/influxdata/kapacitor/edge.NewBeginBatchMessage
       1MB  2.39% 84.44%        1MB  2.39%  github.com/influxdata/kapacitor/tick/stateful.NewFunctions
       1MB  2.38% 86.81%        1MB  2.38%  github.com/influxdata/kapacitor/vendor/github.com/influxdata/influxdb/models.(*point).Name
(pprof) exit
legacy@XXX:~/$ go tool pprof http://localhost:9992/kapacitor/v1/debug/pprof/heap
Fetching profile over HTTP from http://localhost:9992/kapacitor/v1/debug/pprof/heap
Saved profile in /Users/legacy/pprof/pprof.kapacitord.alloc_objects.alloc_space.inuse_objects.inuse_space.033.pb.gz
File: kapacitord
Type: inuse_space
Time: May 22, 2020 at 8:39am (EDT)
Entering interactive mode (type "help" for commands, "o" for options)
(pprof) top
Showing nodes accounting for 60.55MB, 88.24% of 68.62MB total
Showing top 10 nodes out of 140
      flat  flat%   sum%        cum   cum%
   16.50MB 24.05% 24.05%    16.50MB 24.05%  github.com/influxdata/kapacitor/vendor/github.com/influxdata/influxdb/models.Tags.Map
      12MB 17.49% 41.54%       12MB 17.49%  github.com/influxdata/kapacitor/vendor/github.com/influxdata/influxdb/models.(*point).unmarshalBinary
      12MB 17.49% 59.03%       12MB 17.49%  github.com/influxdata/kapacitor.newJoinset
    8.50MB 12.39% 71.42%     8.50MB 12.39%  strings.(*Builder).WriteString
       4MB  5.83% 77.25%        4MB  5.83%  github.com/influxdata/kapacitor/edge.(*pointMessage).ShallowCopy
    2.50MB  3.64% 80.89%        5MB  7.29%  github.com/influxdata/kapacitor/edge.NewBeginBatchMessage
    1.52MB  2.22% 83.12%     1.52MB  2.22%  github.com/influxdata/kapacitor/edge.NewChannelEdge
    1.50MB  2.19% 85.30%     1.50MB  2.19%  github.com/influxdata/kapacitor/vendor/github.com/influxdata/influxdb/models.(*point).Name
    1.01MB  1.48% 86.78%    13.02MB 18.97%  github.com/influxdata/kapacitor.(*joinGroup).Collect
       1MB  1.46% 88.24%        1MB  1.46%  github.com/influxdata/kapacitor/tick/stateful.NewFunctions
(pprof)
This is the template that the tasks are based on that are causing the issue:
var database = 'XXX'
var target_measurement string
var actual_measurement string
var result_measurement string
var window_size = 15s

var target = stream
    |from()
        .measurement(target_measurement)
        .groupBy('*')

var actual = stream
    |from()
        .measurement(actual_measurement)
        .groupBy('*')

var data = actual
    |join(target)
        .as('actual', 'target')
        .tolerance(window_size)
	.fill('null')
    |default()
        .field('actual.value', 999.99)
	.field('target.value', 999.99)
    |where(lambda: "actual.value" != 999.99 AND "target.value" != 999.99)

data
    |eval(lambda: "target.value" - "actual.value")
        .as('value')
    |influxDBOut()
        .measurement(result_measurement)
        .database(database)
        .create()
This is the DOT graph portion of the "show" operation:
DOT:
digraph MyTask {
graph [throughput="0.00 points/s"];

stream0 [avg_exec_time_ns="0s" errors="0" working_cardinality="0" ];
stream0 -> from2 [processed="23380"];
stream0 -> from1 [processed="23380"];

from2 [avg_exec_time_ns="0s" errors="0" working_cardinality="0" ];
from2 -> join4 [processed="18240"];

from1 [avg_exec_time_ns="0s" errors="0" working_cardinality="0" ];
from1 -> join4 [processed="5140"];

join4 [avg_exec_time_ns="0s" errors="0" working_cardinality="59" ];
join4 -> default5 [processed="3198"];

default5 [avg_exec_time_ns="0s" errors="0" fields_defaulted="1356" tags_defaulted="0" working_cardinality="0" ];
default5 -> where6 [processed="3198"];

where6 [avg_exec_time_ns="0s" errors="0" working_cardinality="8" ];
where6 -> log7 [processed="1842"];

log7 [avg_exec_time_ns="0s" errors="0" working_cardinality="0" ];
log7 -> eval8 [processed="1842"];

eval8 [avg_exec_time_ns="0s" errors="0" working_cardinality="8" ];
eval8 -> influxdb_out9 [processed="1842"];

influxdb_out9 [avg_exec_time_ns="0s" errors="0" points_written="1842" working_cardinality="0" write_errors="0" ];
version: 1.5.4 Docker for Mac: 2.0.0.0-mac81 (but also happens on CentOS 7.7 with Docker 18.09.8)
After looking at the code and examining our data streams more carefully I believe I have identified the cause and reproduced this on a pre-built image. The JoinNode assumes that data arriving from each parent will always contain the same set of groups and any mismatched groups (groups that appear in one stream but not the other) will result in a memory leak.
Consider the sample task that I posted in the issue description. Let's say that the data is arriving with the following tags and values:
"actual" stream:
mytag=abc, value=1
mytag=def, value=1
mytag=ghi, value=1
"target" stream:
mytag=def, value=1
mytag=ghi, value=1
mytag=jkl, value=1
The JoinNode will successfully join together the data points with mytag values of "def", and "ghi", but those with "abc" and "jkl" will consume memory and never be released.
I don't see any way of working around this given the current implementation. I considered using a Barrier node, but those would only work for groups that existed at some point and then stopped. Since it is not possible to send a Barrier message for a group(s) that does not exist.
Can someone comment on this behaviour? How can a JoinNode be used if you have no control over the quality of the data arriving on any of the configured parent nodes?
Can someone comment on this behaviour? How can a JoinNode be used if you have no control over the quality of the data arriving on any of the configured parent nodes?
Have you tried using joinNode's On property method? https://docs.influxdata.com/kapacitor/v1.5/nodes/join_node/#on
As your task is grouping by all tags, you end up with a lot of series to be processed in the pipeline. If you don't define any tag(s) to join the streams on, I'm assuming you end up with a cross join which generates a huge amount of series.
Also, is .fill(null) necessary? https://docs.influxdata.com/kapacitor/v1.5/nodes/join_node/#fill
Thanks for your response. I have tried GroupBy() with a static set of dimensions and the wildcard. This does not change the behavior.
No, in this case the Fill() is not necessary. I went thru many iterations because I thought that I wasn’t using the Join node properly. I posted this version because it was the last one that I was using at the time I collected the pprof data.
Showing top 10 nodes out of 80 flat flat% sum% cum cum% 1.37GB 37.29% 37.29% 1.37GB 37.29% github.com/influxdata/kapacitor/vendor/github.com/influxdata/influxdb/models.Tags.Map 1.04GB 28.17% 65.46% 1.04GB 28.17% github.com/influxdata/kapacitor/vendor/github.com/influxdata/influxdb/models.(*point).unmarshalBinary 0.38GB 10.37% 75.84% 0.38GB 10.37% github.com/influxdata/kapacitor/edge.(*pointMessage).ShallowCopy 0.23GB 6.32% 82.16% 0.23GB 6.32% github.com/influxdata/kapacitor/alert.newHandler 0.19GB 5.13% 87.28% 0.19GB 5.13% strings.(*Builder).WriteString 0.08GB 2.11% 89.39% 0.08GB 2.11% github.com/influxdata/kapacitor/vendor/github.com/influxdata/influxdb/models.(*point).Name 0.06GB 1.58% 90.98% 0.06GB 1.58% bytes.makeSlice 0.05GB 1.29% 92.26% 0.05GB 1.32% github.com/influxdata/kapacitor/vendor/github.com/influxdata/influxdb/models.parseTags 0.04GB 1.05% 93.31% 0.04GB 1.05% github.com/influxdata/kapacitor.(*windowTimeBuffer).insert 0.03GB 0.8% 94.11% 0.05GB 1.29% github.com/influxdata/kapacitor/vendor/github.com/influxdata/influxdb/models.parsePoint (pprof)