wpt.fyi
 wpt.fyi copied to clipboard
Search cache error "Failed to fetch test runs" on staging
Steps to reproduce:
- Start at https://staging.wpt.fyi/results/?label=master&label=experimental&aligned
- Search for "(safari:!pass&safari:!ok)", which changes the URL to https://staging.wpt.fyi/results/?label=master&label=experimental&aligned&q=%28safari%3A%21pass%26safari%3A%21ok%29
You should see this:
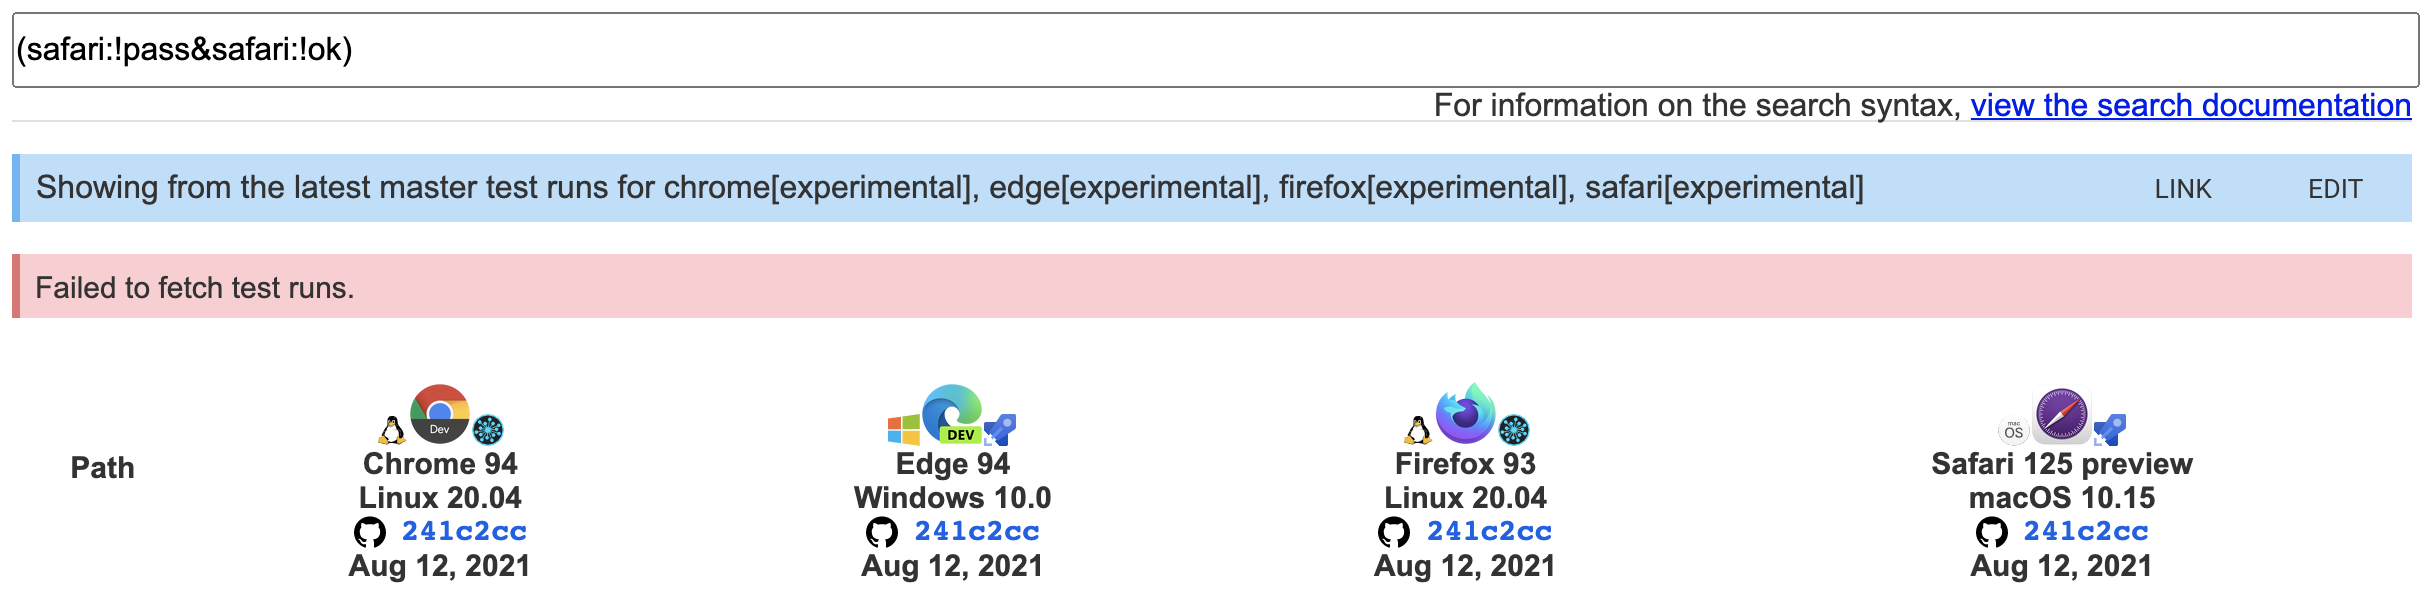
The same steps starting from https://wpt.fyi/results/?label=master&label=experimental&aligned doesn't have the same problem, so this might be a regression in staging.
@KyleJu can you look into this? When was the latest prod push and have any interesting changes happened since then?
This was reported by @gsnedders originally with this example: https://staging.wpt.fyi/results/?q=%28safari%3A%21pass%26safari%3A%21ok%29%20%28firefox%3Apass%7Cfirefox%3Aok%29%20%28chrome%3Apass%7Cchrome%3Aok%29&run_id=5755468253233152&run_id=6204903965851648&run_id=5894387494027264
I was able to search both https://staging.wpt.fyi/results/?q=%28safari%3A%21pass%26safari%3A%21ok%29%20%28firefox%3Apass%7Cfirefox%3Aok%29%20%28chrome%3Apass%7Cchrome%3Aok%29&run_id=5755468253233152&run_id=6204903965851648&run_id=5894387494027264 and (safari:!pass&safari:!ok) without any issues on staging.
My last prod push is last night 11 PM PST time so they should be in sync
There's definitely something up with the cache; https://staging.wpt.fyi/results/?q=%28safari%3A%21pass%26safari%3A%21ok%29%20%28firefox%3Apass%7Cfirefox%3Aok%29%20%28chrome%3Apass%7Cchrome%3Aok%29%20%21sharedworker&run_id=5755468253233152&run_id=6204903965851648&run_id=5894387494027264 now fails for example
The staging deployment using 9c46dad0d0a839f8aa059349fd0f2f8a2228704a also failed at any search queries. searchcache on wpt.fyi is working correctly. Searchcache returns Status Code: 502. I suspect this line from logs
time="2021-09-01T23:02:57Z" level=warning msg="Monitor 7231817552 bytes allocated, exceeding threshold of 6865861632 bytes"
The issues persists today after a new staging deployment. I will create a prod deployment on the same commit and see if the issue lies in the staging deployment or the underlying code
Does that line from the logs amount to a likely memory leak? If so, it will probably always be fine on a new deployment, and only happen eventually once an instance has been running for long enough. Can we see memory usage over time easily?
Took another look today since I am doing a prod release. I am almost certain that its caused by the memory usage. As soon as the log shows Monitor 7361133408 bytes allocated, exceeding threshold of 6865861632 bytes, any requests to searchcache APIs start returning 502.
The memory usage for searchcache on staging hovers around 7.8 GiB~ while the memory usage for searchcache on prod stays at 224 GiB~. Both are in the ballpark of memory_gb specified in app.staging.yaml and app.yaml
I will try increasing memory_gb in app.staging.yam and see what happens
Issue still persists after #2651 time="2021-09-30T20:21:55Z" level=warning msg="Monitor 9313176736 bytes allocated, exceeding threshold of 8979790848 bytes"
The prod release looks good. It means we might need to further increase the memory_gb or cpu in app.staging.yaml
Do you know what has caused the increase in memory usage? And does memory usage increase with the age of the instance, suggesting there's a memory leak?
Do you know what has caused the increase in memory usage? And does memory usage increase with the age of the instance, suggesting there's a memory leak?
I don't think the evidence points to memory leak because the staging instance is being redeployed constantly. We need to dig into the increase in memory. It could be the increasing number of WPT tests that have to be loaded into the memory
Ah, if it happens quickly after deploy then indeed it doesn't sound like a memory leak. A increased number of overall tests seems like a good hypothesis. Another possibility could be golang or some dependency starting to use more memory for each structure used to represent a test result, but then it should have started happening after a change to wpt.fyi was deployed.
@KyleJu I'm seeing this again now. The view I'm trying is this one: https://staging.wpt.fyi/results/?label=master&label=experimental&product=chrome&product=firefox&product=safari&aligned&q=label%3Ainterop-2021
Still seeing this with https://staging.wpt.fyi/results/?label=master&label=experimental&product=chrome&product=firefox&product=safari&product=servo&product=flow&aligned&q=idlharness%20chrome%3Apass%20firefox%3Apass%20safari%3Apass
Still seeing this with https://staging.wpt.fyi/results/?label=master&label=experimental&product=chrome&product=firefox&product=safari&product=servo&product=flow&aligned&q=idlharness%20chrome%3Apass%20firefox%3Apass%20safari%3Apass
Let me do a prod push so you can see it on prod. I would have to increase the memory limit on staging once again and see how much the searchcache needs to work
@gsnedders https://wpt.fyi/results/?label=master&label=experimental&product=chrome&product=firefox&product=safari&product=servo&product=flow&aligned&q=idlharness%20chrome%3Apass%20firefox%3Apass%20safari%3Apass. You can view it on prod now
It appears that #3313 fixed (at least partially) the staging issue. The issue is caused by the convoluted logic of exists root node