vite
 vite copied to clipboard
vite build error: out of memory
Describe the bug
vite build error: out of memory.
Reproduction
Static directory memory is a bit large,There are a lot of MP4 video files,600MB
System Info
viteversion: 2.0.5- Operating System: windows 10
- Node version:14.16.0
- Package manager (npm/yarn/pnpm) and version: npm 6.14.9
Logs (Optional if provided reproduction)
<--- JS stacktrace --->
==== JS stack trace =========================================
0: ExitFrame [pc: 00007FF69790ABBD] Security context: 0x01e6a86408d1 1: decode(aka decode) [000002AD02F874D1] [E:\vite-template\[email protected]@rollup\dist\shared\rollup.js:~133] [pc=0000039464A55451](this=0x037824a004b1 ,0x017863480119 <Very long string[1502653]>) 2: decodedSourcemap(aka decodedSourcemap) [000002AD02F8A979] [E:\vite-template\[email protected]@rollup\dist\shared\roll...
FATAL ERROR: Ineffective mark-compacts near heap limit Allocation failed - JavaScript heap out of memory 1: 00007FF696CD180F napi_wrap+119407 2: 00007FF696C787E6 v8::internal::OrderedHashTablev8::internal::OrderedHashSet,1::NextTableOffset+38102 3: 00007FF696C795E6 node::OnFatalError+438 4: 00007FF6974B5A6E v8::Isolate::ReportExternalAllocationLimitReached+94 5: 00007FF69749DC21 v8::SharedArrayBuffer::Externalize+833 6: 00007FF69734F3FC v8::internal::Heap::EphemeronKeyWriteBarrierFromCode+1436 7: 00007FF69735A640 v8::internal::Heap::ProtectUnprotectedMemoryChunks+1312 8: 00007FF697357154 v8::internal::Heap::PageFlagsAreConsistent+3204 9: 00007FF69734C953 v8::internal::Heap::CollectGarbage+1283 10: 00007FF69734AFC4 v8::internal::Heap::AddRetainedMap+2500 11: 00007FF69736C30D v8::internal::Factory::NewFillerObject+61 12: 00007FF6970CF76F v8::internal::interpreter::JumpTableTargetOffsets::iterator::operator=+1295 13: 00007FF69790ABBD v8::internal::SetupIsolateDelegate::SetupHeap+546925 14: 0000039464A55451
Update It worked when I allocated a whopping 16GB of RAM for Vite's initialization cycle.
As a temporary workaround, you can use the following commands. If it still fails, just increase the size.
Temporary workaround
a. Using command line arguments
node --max_old_space_size=16384 ./node_modules/vite/bin/vite.js
b. Using environment variables
export NODE_OPTIONS=--max-old-space-size=32768
I'm getting the same error on https://github.com/inkline/inkline/tree/inkline3 after updating from 2.0.0-beta.60 to 2.0.5, but during dev, not build.
It looks like a memory leak to me. I've tried starting from a clean project and gradually added my code to it in order to find the issue. I discovered that it only happens when I rm -r node_modules, npm install and then npm run dev. If I work on the project with Vite already initialised and cached, it won't happen. I know that because I've started from a clean project 5 times. Every time after I move the files over to the old location and go through the installation, it will crash.
I tried increasing the memory allocation size to 9GB, but it didn't do the trick.
> vite


<--- Last few GCs --->

[17331:0x108008000]    46671 ms: Mark-sweep (reduce) 9192.9 (9207.7) -> 9192.9 (9207.7) MB, 8.7 / 0.0 ms  (average mu = 0.232, current mu = 0.001) allocation failure scavenge might not succeed
[17331:0x108008000]    46681 ms: Mark-sweep (reduce) 9192.9 (9204.7) -> 9192.9 (9205.7) MB, 9.4 / 0.0 ms  (average mu = 0.149, current mu = 0.029) last resort GC in old space requested


<--- JS stacktrace --->

FATAL ERROR: Ineffective mark-compacts near heap limit Allocation failed - JavaScript heap out of memory
 1: 0x1012e4da5 node::Abort() (.cold.1) [/Users/alexgrozav/.nvm/versions/node/v14.16.0/bin/node]
 2: 0x1000a6239 node::Abort() [/Users/alexgrozav/.nvm/versions/node/v14.16.0/bin/node]
 3: 0x1000a639f node::OnFatalError(char const*, char const*) [/Users/alexgrozav/.nvm/versions/node/v14.16.0/bin/node]
 4: 0x1001e9007 v8::Utils::ReportOOMFailure(v8::internal::Isolate*, char const*, bool) [/Users/alexgrozav/.nvm/versions/node/v14.16.0/bin/node]
 5: 0x1001e8fa3 v8::internal::V8::FatalProcessOutOfMemory(v8::internal::Isolate*, char const*, bool) [/Users/alexgrozav/.nvm/versions/node/v14.16.0/bin/node]
 6: 0x100397e95 v8::internal::Heap::FatalProcessOutOfMemory(char const*) [/Users/alexgrozav/.nvm/versions/node/v14.16.0/bin/node]
 7: 0x10039995a v8::internal::Heap::RecomputeLimits(v8::internal::GarbageCollector) [/Users/alexgrozav/.nvm/versions/node/v14.16.0/bin/node]
 8: 0x100395029 v8::internal::Heap::PerformGarbageCollection(v8::internal::GarbageCollector, v8::GCCallbackFlags) [/Users/alexgrozav/.nvm/versions/node/v14.16.0/bin/node]
 9: 0x1003928c1 v8::internal::Heap::CollectGarbage(v8::internal::AllocationSpace, v8::internal::GarbageCollectionReason, v8::GCCallbackFlags) [/Users/alexgrozav/.nvm/versions/node/v14.16.0/bin/node]
10: 0x1003932d2 v8::internal::Heap::CollectAllAvailableGarbage(v8::internal::GarbageCollectionReason) [/Users/alexgrozav/.nvm/versions/node/v14.16.0/bin/node]
11: 0x1003a121e v8::internal::Heap::AllocateRawWithRetryOrFailSlowPath(int, v8::internal::AllocationType, v8::internal::AllocationOrigin, v8::internal::AllocationAlignment) [/Users/alexgrozav/.nvm/versions/node/v14.16.0/bin/node]
12: 0x10036eb87 v8::internal::Factory::NewFillerObject(int, bool, v8::internal::AllocationType, v8::internal::AllocationOrigin) [/Users/alexgrozav/.nvm/versions/node/v14.16.0/bin/node]
13: 0x1006ed8d8 v8::internal::Runtime_AllocateInYoungGeneration(int, unsigned long*, v8::internal::Isolate*) [/Users/alexgrozav/.nvm/versions/node/v14.16.0/bin/node]
14: 0x100a7a239 Builtins_CEntry_Return1_DontSaveFPRegs_ArgvOnStack_NoBuiltinExit [/Users/alexgrozav/.nvm/versions/node/v14.16.0/bin/node]
15: 0x100accdde Builtins_RegExpSplit [/Users/alexgrozav/.nvm/versions/node/v14.16.0/bin/node]
zsh: abort      npm run dev
Randomly, I also get this error:
<--- Last few GCs --->

[18228:0x110008000]    43509 ms: Mark-sweep (reduce) 9192.9 (9204.7) -> 9192.9 (9205.7) MB, 8.9 / 0.0 ms  (average mu = 0.154, current mu = 0.039) last resort GC in old space requested
[18228:0x110008000]    43518 ms: Mark-sweep (reduce) 9192.9 (9204.7) -> 9192.9 (9205.7) MB, 9.0 / 0.0 ms  (average mu = 0.087, current mu = 0.001) last resort GC in old space requested


<--- JS stacktrace --->

FATAL ERROR: CALL_AND_RETRY_LAST Allocation failed - JavaScript heap out of memory
 1: 0x1012e4da5 node::Abort() (.cold.1) [/Users/alexgrozav/.nvm/versions/node/v14.16.0/bin/node]
 2: 0x1000a6239 node::Abort() [/Users/alexgrozav/.nvm/versions/node/v14.16.0/bin/node]
 3: 0x1000a639f node::OnFatalError(char const*, char const*) [/Users/alexgrozav/.nvm/versions/node/v14.16.0/bin/node]
 4: 0x1001e9007 v8::Utils::ReportOOMFailure(v8::internal::Isolate*, char const*, bool) [/Users/alexgrozav/.nvm/versions/node/v14.16.0/bin/node]
 5: 0x1001e8fa3 v8::internal::V8::FatalProcessOutOfMemory(v8::internal::Isolate*, char const*, bool) [/Users/alexgrozav/.nvm/versions/node/v14.16.0/bin/node]
 6: 0x100397e95 v8::internal::Heap::FatalProcessOutOfMemory(char const*) [/Users/alexgrozav/.nvm/versions/node/v14.16.0/bin/node]
 7: 0x1003a128c v8::internal::Heap::AllocateRawWithRetryOrFailSlowPath(int, v8::internal::AllocationType, v8::internal::AllocationOrigin, v8::internal::AllocationAlignment) [/Users/alexgrozav/.nvm/versions/node/v14.16.0/bin/node]
 8: 0x10036eb87 v8::internal::Factory::NewFillerObject(int, bool, v8::internal::AllocationType, v8::internal::AllocationOrigin) [/Users/alexgrozav/.nvm/versions/node/v14.16.0/bin/node]
 9: 0x1006ed8d8 v8::internal::Runtime_AllocateInYoungGeneration(int, unsigned long*, v8::internal::Isolate*) [/Users/alexgrozav/.nvm/versions/node/v14.16.0/bin/node]
10: 0x100a7a239 Builtins_CEntry_Return1_DontSaveFPRegs_ArgvOnStack_NoBuiltinExit [/Users/alexgrozav/.nvm/versions/node/v14.16.0/bin/node]
11: 0x100accdde Builtins_RegExpSplit [/Users/alexgrozav/.nvm/versions/node/v14.16.0/bin/node]
zsh: abort      node --max_old_space_size=9192 ./node_modules/vite/bin/vite.js
I'm getting the same error on https://github.com/IduxFE/idux
// scripts/gulp/util/task-helpers.ts
execTask('node', ['--max_old_space_size=10240', binPath].concat(args || []), env)(done)
Need to adjust max_old_space_size to 10GB to work, but some members of our team have only 8G memory on their devices.
For me at least, Vite was compiling my tests coverage folder which led to this heap error so I had to specify root: src in the config. Maybe optimizeDeps could also be set to exclude coverage but I haven't tried it.
I could only get it to work with node 15 on an Apple M1 without having to increase the max_old_space_size value. Either node 12 or 14 would run out of memory.
It turns out I also had a coverage directory that was the cause of this issue.
I can't seem to set the root to 'src', no matter what I try, unless (I guess) I move the index.html file into src?
Either way, it would be good to have some sort of exclude option in the Vite config for this.
Edit: I wonder if it's due to there being an index.html file in one of those directories and Vite picking that up as if it were an entry point. Might be worth investigating from that angle.
Even a Circle CI run: https://app.circleci.com/pipelines/github/vitejs/vite/3715/workflows/154262d9-1609-4f93-a362-41e50918cf11/jobs/3597
(#2888)
<--- Last few GCs --->

[465:0x37ff900]    74301 ms: Scavenge 2041.9 (2050.4) -> 2041.7 (2051.2) MB, 5.1 / 0.0 ms  (average mu = 0.084, current mu = 0.002) allocation failure
[465:0x37ff900]    75575 ms: Mark-sweep 2042.6 (2051.2) -> 2037.8 (2051.2) MB, 1270.9 / 0.0 ms  (average mu = 0.051, current mu = 0.007) allocation failure scavenge might not succeed


<--- JS stacktrace --->

==== JS stack trace =========================================

    0: ExitFrame [pc: 0x13c03d9]
Security context: 0x12c6db5c08d1 <JSObject>
    1: SourceMapConsumer_parseMappings [0x100c6c4bb049] [/root/project/node_modules/source-map/lib/source-map-consumer.js:~468] [pc=0x3eb3b586d69f](this=0x10d5c9effde1 <BasicSourceMapConsumer map = 0x3ae106481d9>,0x06e149980119 <Very long string[2174608]>,0x05768dc401b9 <null>)
    2: get [0x35b2e0a43891] [/root/project/node_modules/source-map/lib/source-map-cons...

FATAL ERROR: Ineffective mark-compacts near heap limit Allocation failed - JavaScript heap out of memory

Writing Node.js report to file: report.20210416.144649.465.0.001.json
Node.js report completed
 1: 0xa02f90 node::Abort() [/usr/local/bin/node]
 2: 0xa033b5 node::OnFatalError(char const*, char const*) [/usr/local/bin/node]
 3: 0xb76ffe v8::Utils::ReportOOMFailure(v8::internal::Isolate*, char const*, bool) [/usr/local/bin/node]
 4: 0xb77379 v8::internal::V8::FatalProcessOutOfMemory(v8::internal::Isolate*, char const*, bool) [/usr/local/bin/node]
 5: 0xd23ad5  [/usr/local/bin/node]
 6: 0xd24166 v8::internal::Heap::RecomputeLimits(v8::internal::GarbageCollector) [/usr/local/bin/node]
 7: 0xd309e5 v8::internal::Heap::PerformGarbageCollection(v8::internal::GarbageCollector, v8::GCCallbackFlags) [/usr/local/bin/node]
 8: 0xd31895 v8::internal::Heap::CollectGarbage(v8::internal::AllocationSpace, v8::internal::GarbageCollectionReason, v8::GCCallbackFlags) [/usr/local/bin/node]
 9: 0xd3434c v8::internal::Heap::AllocateRawWithRetryOrFail(int, v8::internal::AllocationType, v8::internal::AllocationOrigin, v8::internal::AllocationAlignment) [/usr/local/bin/node]
10: 0xcfaf1b v8::internal::Factory::NewFillerObject(int, bool, v8::internal::AllocationType, v8::internal::AllocationOrigin) [/usr/local/bin/node]
11: 0x103d85e v8::internal::Runtime_AllocateInYoungGeneration(int, unsigned long*, v8::internal::Isolate*) [/usr/local/bin/node]
12: 0x13c03d9  [/usr/local/bin/node]
Aborted (core dumped)
error Command failed with exit code 134.
info Visit https://yarnpkg.com/en/docs/cli/run for documentation about this command.

Exited with code exit status 134
CircleCI received exit code 134
Running into this issue on my 8GB M1 macbook. Can we expect a fix for this soon?
@samuveth You should workaround this by using --max-old-space-size=<your-mem -512mb or so> for now
Also, just set it as an env variable and you don't have to call Vite's js script directly:
# where xxxx = (your memory in GiB) * 1024 - 512
export NODE_OPTIONS='--max-old-space-size=xxxx'
@Shinigami92
I think the "has work around" label should be removed and the priority of this issue should be increased.
--max-old-space-size=<your-mem -512mb or so> is a horrible hack.
I would consider this a severe bug worth avoiding Vite over.
The lack of priority leads me to believe it must only be affecting a minority of users; nevertheless, this is not dependable for production.
 ens...
would also help to get an actual simple reproduction in a github/stackblitz repo
I would check if its compiling a coverage folder, dist folder, or something else unintended.
For me, I was experiencing memory errors because of some heavy libraries used in my React application. I observed Vite was transforming over 7000 files every time I added these heavy libraries to the production build process.
To fix it, I had to find alternative ways to import those libraries or use their minified versions or import just the needed sub-packages for libraries with sub-packages like _lodash.
Lastly, disabling the source map in the Vite config reduced the memory needed to build my application by more than 500MB.
I see some people are encountering this with vite dev. In that case, you should (1) connect the Chrome inspector to your Vite process and (2) pause the step debugger (do this shortly after starting the dev server and without loading anything in your browser). It's possible that you have a relatively complex circular directory symlink chain, and readdirp is being tricked into infinitely crawling those directories (but asynchronously, thereby avoiding a stack overflow). If the step debugger opens a readdirp file, you can be sure this is your issue. This is common if you're developing a chain of packages locally and linking one of them into your Vite project.
Using the server.watch.ignored option in Vite config, you can prevent chokidar (the file watcher that Vite uses) from watching the circular directory chain.
export NODE_OPTIONS='--max-old-space-size=512'
did help if building on a memory-limit device, like Raspberry Pi 3. But I still believe some optimization would be great.
This is a critical issue and there is no one investigating it ? (didn't expect that from vite team :( )
Hi @nichita-pasecinic, please see this comment:
would also help to get an actual simple reproduction in a github/stackblitz repo
@aleclarson The issue is reproduceable on large codebase with lots of dependencies, I guess no one will leak the enterprise application source code just for the repro. It actually worked ok without any 'out of memory' errors until a specific commit (a very small one) that did not included any dependency or had other thinks that might request more memory for build time (previously was 2GB now increased to 4GB), it was added a single (and simple) react component and that's all. I will try to recreate a repro with similar dependency, but there is as well a big codebase that might affect issue, I think you should try to investigate it too, because obviously is a big issues that can be just leaved open until someone will find a reproduction.
I believe this issue is reproducible with memory-limit device. In my case, raspberry pi 3 (1GB RAM). My spa is small, vite with naive-ui, date-fns, mitt. I do not mind it would take way longer than X86 workstation. But broken with GC error is frustrating. Hoping there could be some throttling mechanism implemented.
I am having the same issue on a rather large codebase with a lot of dependencies. The build process uses up towards 30GB of ram 😲 This is a serious memory leak and might have to move away from vite, which is sad cause the dev process is super fast and enjoyable.
@aleclarson The issue is reproduceable on large codebase with lots of dependencies, I guess no one will leak the enterprise application source code just for the repro. (...) .I will try to recreate a repro with similar dependency, but there is as well a big codebase that might affect issue, I think you should try to investigate it too, because obviously is a big issues that can be just leaved open until someone will find a reproduction.
@nichita-pasecinic since it makes sense that an enterprise app can't be opened to provide a repro, maybe your company or some of the other ones that are experiencing this problem could place some resources to investigate the issue and see if it is a problem in Vite or Rollup. In both projects, a PR to fix this would be highly appreciated.
Hello @vijay19920608. We like your proposal/feedback and would appreciate a contribution via a Pull Request by you or another community member. We thank you in advance for your contribution and are looking forward to reviewing it!
@patak-dev well, I've found the commit that breaks the CI (meaning it consumes more then 2GB for build time), but could not yet reproduce it on a "simple" app, cause the application itself is pretty massive.
@Niputi it is a simple component refactor, nothing really special, unfortunately I can't share organization source cod. The commit is about adding a new component (~80lines) to just simplify another big component.
At https://github.com/sveltejs/kit/issues/4795, @Axeldeblen provided a repro (https://github.com/Axeldeblen/realworld-big-build) with sveltekit which is failing on the vite ssr build phase. It should be relevant here too as sveltekit doesn't do a lot of heavy lifting while Vite is building.
Hi Vite team, we're also experiencing this issue. All seemed fine until we added "autoprefixer": "^10.4.4" to our project. After that our memory usage from Vite builds more than tripled. I don't think it's that module but perhaps some common dependency? I was not able to identify a specific dependency in the tree which seemed to be the offender.
We're using:
"vite": "^2.8.6",
"vite-plugin-ssr": "^0.3.61"
You can set node to inspect in the sample project by updating package.json:
"build": "node --inspect ./node_modules/@sveltejs/kit/svelte-kit.js build --verbose",
It was freezing my Chrome instance, so I had to select the "Allocation sampling" option on the inspect page. Maybe someone else would have better luck.
It looks to me like all the memory usage is instances of NodeBase being created by parseNode.
It looks like this stuff is being cached. I wonder if that's related to the memory leak?
https://github.com/rollup/rollup/blob/275dc2fa34e1aaad37a29360570dc85b1ba019a6/src/ModuleLoader.ts#L274
Given that it seems like this issue is coming from Rollup, I would recommend anyone who wants to see this fixed try to see if you can create a very large Rollup project which crashes similarly to the SvelteKit project, file a bug in the Rollup repository, and link it here. This is getting to be far enough away from the SvelteKit codebase that I don't have enough expertise to fix the issue and so it'd have to be reported to Rollup.
from Rollup for reference - https://rollupjs.org/guide/en/#error-javascript-heap-out-of-memory
export NODE_OPTIONS='--max-old-space-size=512'
Unluckily, this solution is not for me.
It's not related to codebase size or dependencies number. I've a small project with 16 dependencies and the issue occurs since my last commit, even with a max-old-space-size of 20GB.
@Niputi
For now, if I uncomment one of this import then the build breaks:

Edit: Because these services are also used by a Web Workers
And I can see this warning:

It's probably related...
Edit: The warning is not always on the same file
your message is not the same as the reported build errors for issue. please open a new issue with a reproduction via vite.new or a github repository
then please provide a github repository or a reproduction via vite.new so it will be easier for us to look through
vite v2.9.9 building for production...
✓ 391 modules transformed.
✓ 603 modules transformed.
✓ 885 modules transformed.
✓ 896 modules transformed.
✓ 1120 modules transformed.
✓ 1344 modules transformed.
transforming (1538) node_modules\@fingerprintjs\fingerprintjs\dist\fp.esm.js(node:36892) MaxListenersExceededWarning: Possible EventEmitter memory leak detected. 11 beforeExit listeners added to [process]. Use emitter.setMaxListeners() to increase limit
(Use `node --trace-warnings ...` to show where the warning was created)
✓ 1584 modules transformed.
✓ 1813 modules transformed.
✓ 2043 modules transformed.
✓ 2255 modules transformed.
✓ 2482 modules transformed.
✓ 2709 modules transformed.
✓ 2936 modules transformed.
✓ 3163 modules transformed.
✓ 3390 modules transformed.
✓ 3616 modules transformed.
✓ 3844 modules transformed.
✓ 4071 modules transformed.
✓ 4298 modules transformed.
✓ 4535 modules transformed.
✓ 4765 modules transformed.
✓ 4990 modules transformed.
✓ 5230 modules transformed.
✓ 5433 modules transformed.
✓ 5670 modules transformed.
✓ 5888 modules transformed.
✓ 6113 modules transformed.
✓ 6341 modules transformed.
✓ 6568 modules transformed.
✓ 6795 modules transformed.
✓ 7022 modules transformed.
✓ 7258 modules transformed.
✓ 7476 modules transformed.
✓ 7697 modules transformed.
✓ 7930 modules transformed.
✓ 8167 modules transformed.
✓ 8396 modules transformed.
✓ 8612 modules transformed.
✓ 8838 modules transformed.
✓ 9064 modules transformed.
✓ 9302 modules transformed.
✓ 9535 modules transformed.
✓ 9746 modules transformed.
✓ 9973 modules transformed.
✓ 10199 modules transformed.
✓ 10427 modules transformed.
✓ 10654 modules transformed.
✓ 10881 modules transformed.
✓ 11108 modules transformed.
✓ 11335 modules transformed.
✓ 11562 modules transformed.
✓ 11799 modules transformed.
✓ 12016 modules transformed.
✓ 12243 modules transformed.
✓ 12470 modules transformed.
✓ 12705 modules transformed.
✓ 12936 modules transformed.
✓ 13166 modules transformed.
✓ 13391 modules transformed.
✓ 13620 modules transformed.
✓ 13835 modules transformed.
✓ 14059 modules transformed.
✓ 14296 modules transformed.
✓ 14513 modules transformed.
✓ 14750 modules transformed.
✓ 14978 modules transformed.
✓ 15194 modules transformed.
✓ 15421 modules transformed.
✓ 15648 modules transformed.
✓ 15849 modules transformed.
✓ 16072 modules transformed.
✓ 16327 modules transformed.
✓ 16556 modules transformed.
✓ 16783 modules transformed.
✓ 17010 modules transformed.
✓ 17237 modules transformed.
✓ 17465 modules transformed.
✓ 17666 modules transformed.
✓ 17928 modules transformed.
✓ 18161 modules transformed.
✓ 18384 modules transformed.
✓ 18599 modules transformed.
✓ 18797 modules transformed.
✓ 19053 modules transformed.
✓ 19290 modules transformed.
✓ 19522 modules transformed.
✓ 19734 modules transformed.
✓ 19961 modules transformed.
✓ 20188 modules transformed.
✓ 20425 modules transformed.
✓ 20642 modules transformed.
✓ 20864 modules transformed.
transforming (20895) src\components\mp-app-ui\mp-idle\helpers\axios.js
<--- Last few GCs --->

[36892:000001F7F719ADD0]    96796 ms: Mark-sweep 4017.3 (4129.4) -> 4003.9 (4127.1) MB, 3995.8 / 0.0 ms  (average mu = 0.099, current mu = 0.033) allocation failure scavenge might not succeed
[36892:000001F7F719ADD0]    96836 ms: Scavenge 4020.2 (4127.1) -> 4011.0 (4127.1) MB, 10.3 / 0.0 ms  (average mu = 0.099, current mu = 0.033) allocation failure
[36892:000001F7F719ADD0]    96887 ms: Scavenge 4020.0 (4127.1) -> 4014.3 (4131.4) MB, 40.0 / 0.0 ms  (average mu = 0.099, current mu = 0.033) task


<--- JS stacktrace --->

FATAL ERROR: Ineffective mark-compacts near heap limit Allocation failed - JavaScript heap out of memory
 1: 00007FF79B31013F v8::internal::CodeObjectRegistry::~CodeObjectRegistry+112495
 2: 00007FF79B29F396 DSA_meth_get_flags+65526
 3: 00007FF79B2A024D node::OnFatalError+301
 4: 00007FF79BBD19EE v8::Isolate::ReportExternalAllocationLimitReached+94
 5: 00007FF79BBBBECD v8::SharedArrayBuffer::Externalize+781
 6: 00007FF79BA5F61C v8::internal::Heap::EphemeronKeyWriteBarrierFromCode+1468
 7: 00007FF79BA6C2C9 v8::internal::Heap::PublishPendingAllocations+1129
 8: 00007FF79BA6929A v8::internal::Heap::PageFlagsAreConsistent+2842
 9: 00007FF79BA5BF19 v8::internal::Heap::CollectGarbage+2137
10: 00007FF79BA5A0D0 v8::internal::Heap::AllocateExternalBackingStore+2000
11: 00007FF79BA7EA06 v8::internal::Factory::NewFillerObject+214
12: 00007FF79B7B1CD5 v8::internal::DateCache::Weekday+1797
13: 00007FF79BC5F3E1 v8::internal::SetupIsolateDelegate::SetupHeap+494417
14: 00007FF79BC455F6 v8::internal::SetupIsolateDelegate::SetupHeap+388454
15: 000001F780A07E77
@Niputi here is a minimal test repo: https://github.com/stillgbx/vite-build-issue

PS: Like in my original project, I use a Web Worker (imported with the query suffix ?worker) and I realize now that it finally imports things that it (probably) shouldn't import. So for this case I would say it's a design issue introduced by the last commit. Nevertheless I hope that this test can help solving the original issue.
Can't believe this problem has existed for more than a year, I repeated this problem when build with source map.
I refer to the above scheme for temporary solution: NODE_OPTIONS='--max-old-space-size=4096' yarn build
@guohui666 开sourcemap了吗?我那个开了sourcemap 巨大无比,关了就行了,但是我那个项目小。https://github.com/n9e/fe-v5
@guohui666 如果解决了,一定分享一下solution哈。我怕我们项目代码越来越多,估计也有这问题
可以试试 NODE_OPTIONS='--max-old-space-size=4096' yarn build
@stillgbx FYI Your issue is same with #7015. There is the following circular dependency which includes a worker.
- workers/worker.js
- services/service.js
- helpers/helper.js
- store/store.js
- components/comp-1/store/store.js
- components/comp-1/store/actions.js
- workers/worker.js
Thank you @sapphi-red Yes I identified that. I still think vite should notify us of the circular dependency if it can detect it.
"scripts": { "dev": "vite", "build": "cross-env NODE_OPTIONS=--max_old_space_size=10240 vite build", "preview": "vite preview" }
加大node内存
A curious discovery we've made- having encountered this issue, we were able to mitigate somewhat by chunking our bundle. This resolved the issue for us (allowing us to run on a much lower memory allocation). However, when we run vite build --mode custom-mode we run back into the heap full error.
It seems that setting a build mode other than production is affecting the ease of surfacing this particular error
Keeping NODE_OPTIONS=--max-old-space-size=8192 in my build script (package.json) worked.
"build": "NODE_OPTIONS=--max-old-space-size=8192 vite build"
This is a bit hacky, but it should be solved.
It does, if you have that amount of memory. In our case, this bug means that we are now paying for more expensive build servers. That's a work around, but IMO the priority of this bug (vite consuming an insane amount of memory) should be quite high.
Unless you have an environment with enough RAM, the --max-old-space-size=8192 isn't going to help, unfortunately.
So, to flesh out the workaround for those who can't afford to bump their environments for a build-only script, try to limit the node stack size. For 1~~GB~~MB:
node --stack-size=1024 ./node_modules/.bin/vite build
Works like a charm in a kubernetes setup (node:18-alpine) with 3GB RAM nodes. Just runs a lot slower.
Note you can't add --stack-size to NODE_OPTIONS (afaik, at least).
EDIT: Nah, this doesn't do much, after all (seems to have been more of a fluke than anything, that it worked a couple of times). I think all small-memory-size devices will just have to be put aside until whatever memory leak happening on writeFile is plugged. :/
In my opinion "workaround" tags should be removed. We face this issue and can't use platforms like Vercel because our app consumes more than 8GB of RAM that they offer and it's not configureable.
I finally solved it by splitting the code into chunks 😅. I think that the reason it was happening was I had a very large chunk (my app is very big ~enterprise like codebase) It's size was 3mb/600kb gzip. Now, i have simply split them into different chunks by using splitVendorChunkPlugin
With this, we do not need to use the ugly --max-old-space-size=8192 NODE_OPTION anymore.
P.S: The issue is coming from rollup itself. As mentioned here https://rollupjs.org/guide/en/#error-javascript-heap-out-of-memory
then please provide a github repository or a reproduction via vite.new so it will be easier for us to look through
@Niputi you can try my repo, things break after Glob Import is used. About 8m files are imported.
the commit that breaks CI https://github.com/Zzzen/pyright-ast-viewer/commit/c46fec7d1f21f9c28216c8a183dd1bcaa6ce7103 CI status https://github.com/Zzzen/pyright-ast-viewer/runs/7094218685?check_suite_focus=true
I've also been affected by this issue, and my project isn't even that big:
dist/assets/favicon.17e50649.svg   1.49 KiB
dist/index.html                    0.60 KiB
dist/assets/index.cc3a812a.js      22.91 KiB / gzip: 8.16 KiB
dist/assets/vendor.3fca7309.css    75.80 KiB / gzip: 9.82 KiB
dist/assets/index.41aec47a.css     311.17 KiB / gzip: 42.48 KiB
dist/assets/vendor.cdabcb6a.js     863.05 KiB / gzip: 245.12 KiB
Using splitVendorPlugin did not help, neither did NODE_OPTIONS=--max-old-space-size. Only thing that helps is adding more RAM to the system for the build...
For me it was the legacyBuild plugin that was making the build excessively long. From 30min -> 30seconds.
@guguji5 把sourcemap关掉了之后尝试了一下,还是一样的
有没有可能是
vue-tsc的版本低导致的问题
https://github.com/n9e/fe-v5/blob/master/package.json 我似乎没有用vue-tsc,是一个react项目
@guguji5 把sourcemap关掉了之后尝试了一下,还是一样的
有没有可能是
vue-tsc的版本低导致的问题https://github.com/n9e/fe-v5/blob/master/package.json 我似乎没有用vue-tsc,是一个react项目 我回复@guohui666 的vite+ vue3+ts问题, 不小心@了你,不好意思。
It looks like @Shinigami92 isn't that active anymore in this repo. Therefore tagging two other vite members. @sapphi-red or @bluwy, do you agree that the priority of this bug is too low? Could you please increase it?
It looks like @Shinigami92 isn't that active anymore in this repo. Therefore tagging two other vite members. @sapphi-red or @bluwy, do you agree that the priority of this bug is too low? Could you please increase it?
I'm in an open source vacation month for July + I cannot do any much here with my knowledge + I'm heavily maintaining @faker-js since Jan. this year.
Beside that, like Niputi already wrote, PRs are welcome Reproductions are welcome Looks like it's hard to reproduce and therefore also hard to fix :thinking:
Limited the memory by node --max_old_space_size=7168 node_modules/.bin/vite --config config/vite.config.ts build. However, I still have the same issue. The most interesting part is that the CircleCI memory usage is far from even 50%,
It's not a pure vite project but the example repo I provided earlier in this thread provides a pretty simple reproduction of the issue from svelte kit.
Looks like all you need to do to reproduce it reliably is inflate the amount of files that need to be transformed. @benmccann did some debugging and suggested it may be an upstream issue from rollup.
Maybe someone could follow the same concept and create a vite project which can reproduce the issue in a similar way.
This is very frustrating. I'm getting the same error. If you are intended to use a 3GB RAM resource from AWS codebuild just stop wasting your time and forget this using vite idea.
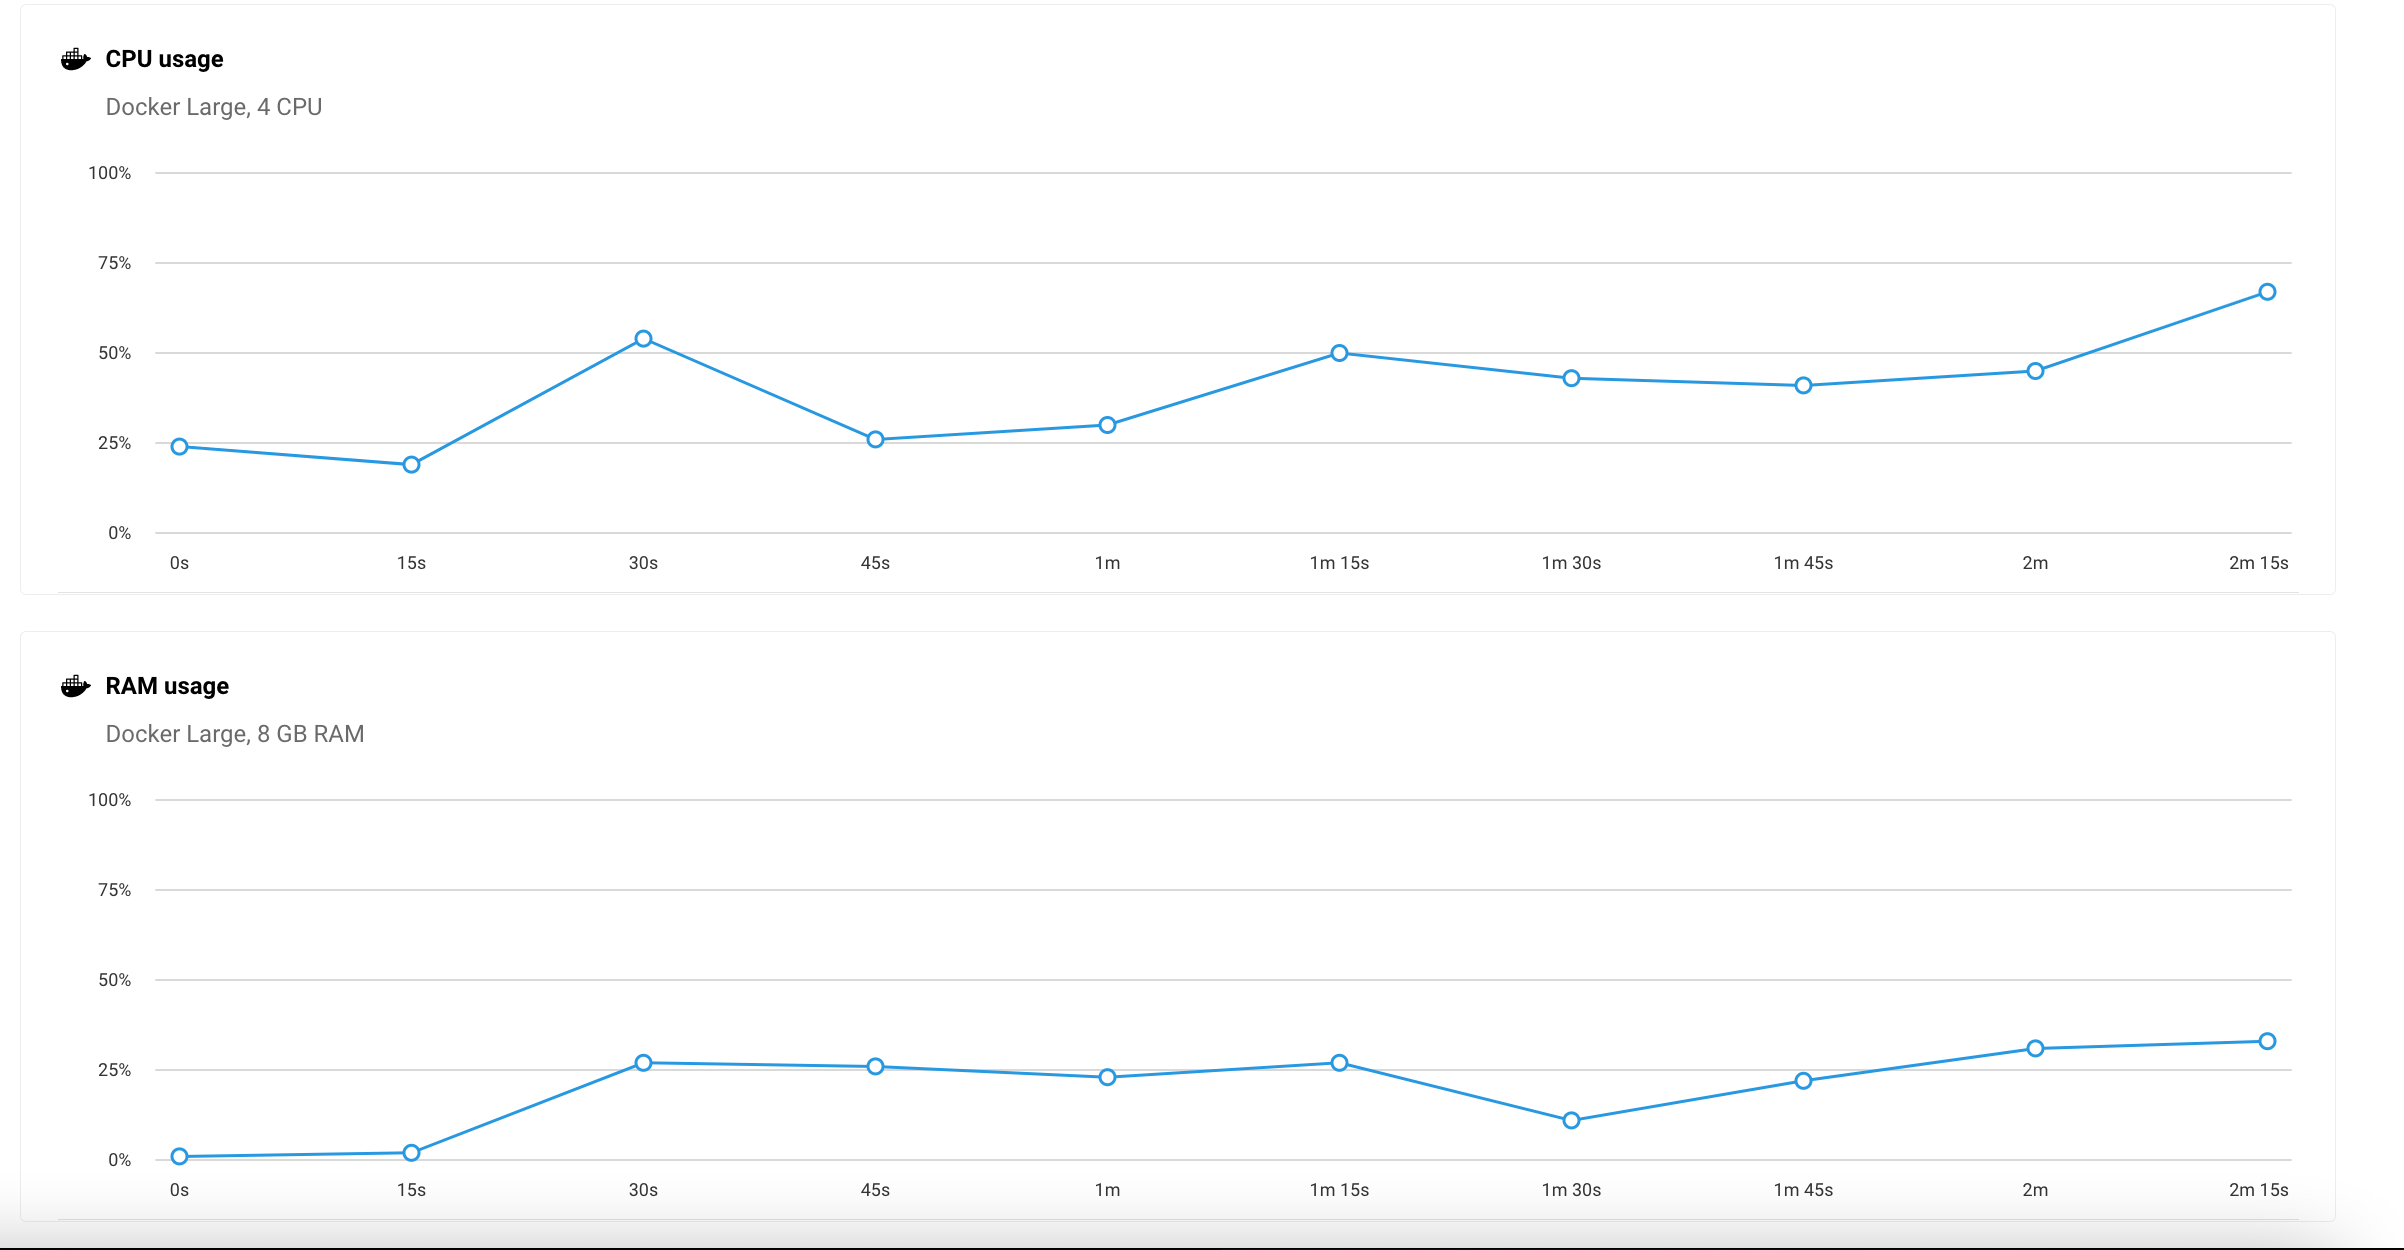
Quite a funny one. Circle CI shows that the build is using too much CPU, not memory
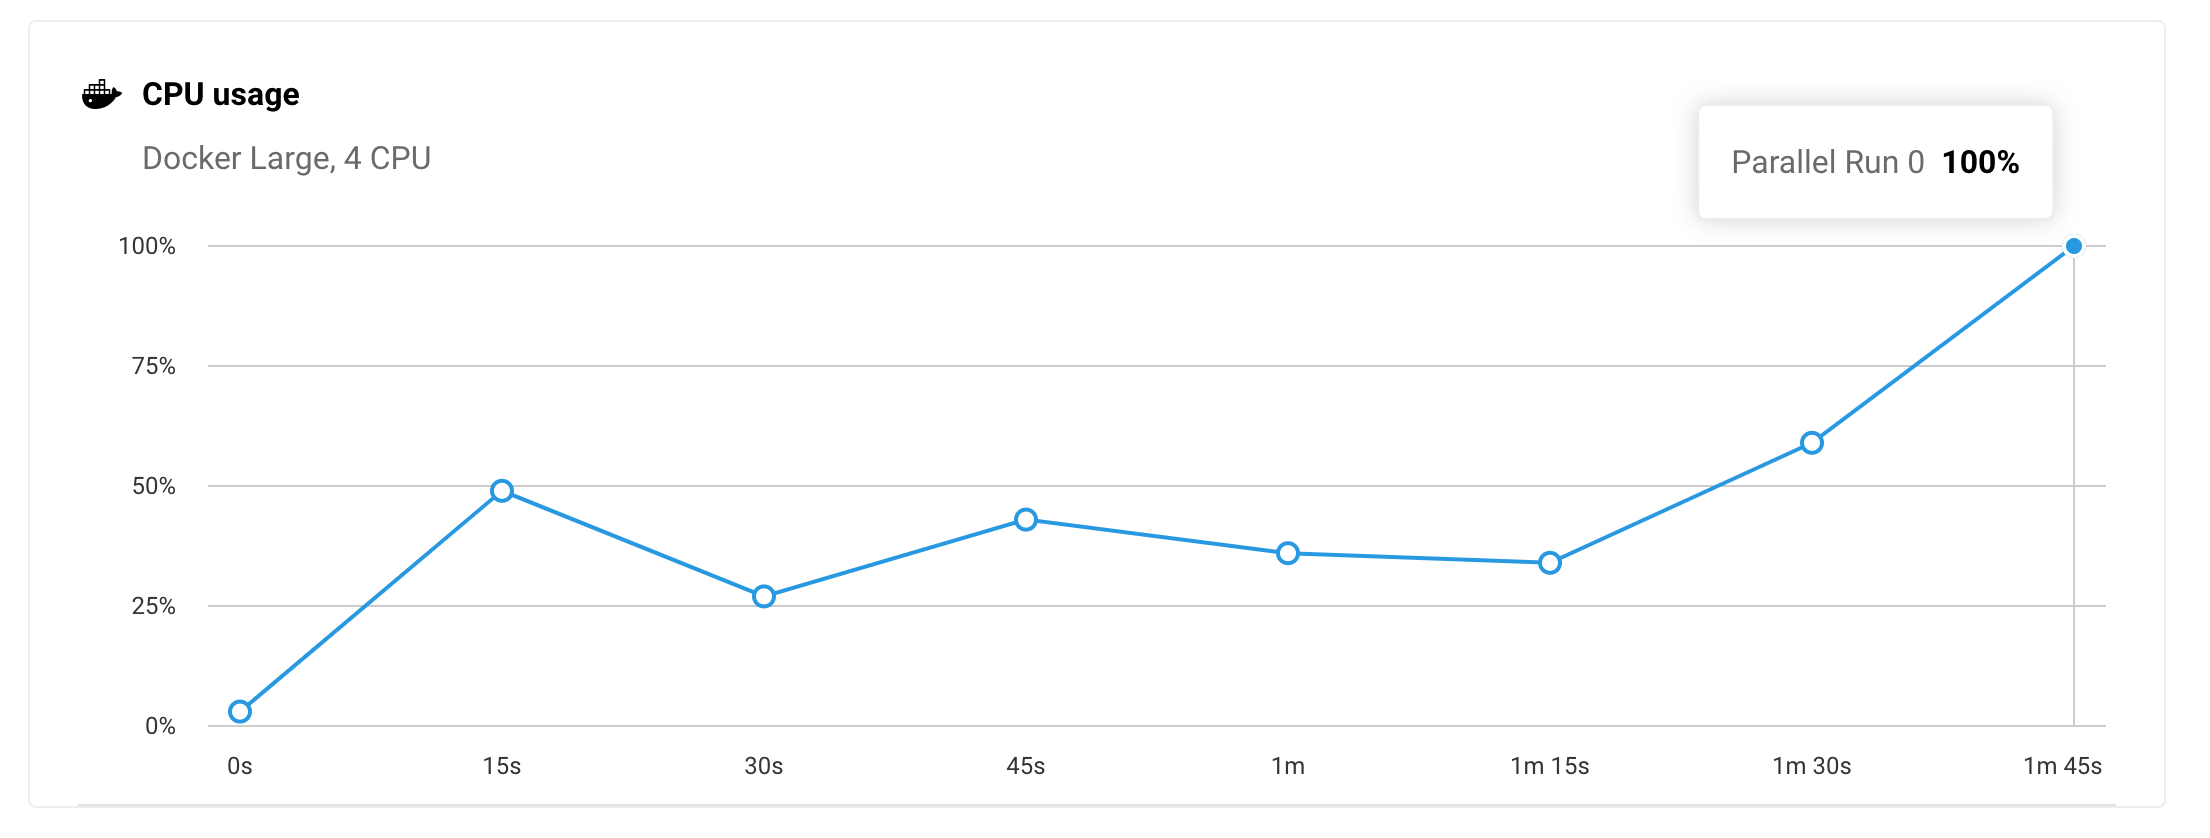
I had something like this with webpack and it was with minifying. The Terser plugin can't read the number of CPUs of the running machine and it uses more CPUs than it's available. So the solution was to manually pass parallel option with the value of the number of CPUs available.
When I tried to get the number of CPUs in the circleci machine I got 36 (require('os').cpus().length). However, it, actually, was 4 CPU Linux machine.
So, maybe rollup uses the os.cpus() somewhere?
Although I don't have a direct solution, I can confirm the following:
- Sourcemaps are a major source for the problem. Memory spiking in our builds went from 7GB to 2GB when disabling sourcemaps.
- Code splitting via dynamic imports helped resolve the issue. This is, of course, not always possible.
rollup-plugin-visualizerhelped me decide the most profitable opportunities for code splitting. It helped illustrate which modules were the largest that had the least number of touchpoints.
Utilizing manualChunks might help if you can manage it, although I haven't tested this yet.
I'm experiencing this on Github Actions:
vite v3.0.2 building for production...
transforming...
✓ [17](https://github.com/.../runs/7422089543?check_suite_focus=true#step:6:18)431 modules transformed.
<--- Last few GCs --->
[2335:0x663e6c0]    90499 ms: Mark-sweep 2006.9 (2087.3) -> 1994.2 (2089.5) MB, [18](https://github.com/.../runs/7422089543?check_suite_focus=true#step:6:19)16.9 / 0.0 ms  (average mu = 0.702, current mu = 0.264) allocation failure scavenge might not succeed
[2335:0x663e6c0]    92710 ms: Mark-sweep 2011.6 (2090.3) -> 2003.1 (2100.6) MB, 2120.1 / 0.0 ms  (average mu = 0.517, current mu = 0.041) allocation failure scavenge might not succeed
<--- JS stacktrace --->
FATAL ERROR: Reached heap limit Allocation failed - JavaScript heap out of memory
 1: 0xb0a860 node::Abort() [node]
 2: 0xa1c[19](https://github.com/.../runs/7422089543?check_suite_focus=true#step:6:20)3 node::FatalError(char const*, char const*) [node]
 3: 0xcf9a6e v8::Utils::ReportOOMFailure(v8::internal::Isolate*, char const*, bool) [node]
 4: 0xcf9de7 v8::internal::V8::FatalProcessOutOfMemory(v8::internal::Isolate*, char const*, bool) [node]
 5: 0xeb1685  [node]
 6: 0xec1[34](https://github.com/.../runs/7422089543?check_suite_focus=true#step:6:35)d v8::internal::Heap::CollectGarbage(v8::internal::AllocationSpace, v8::internal::GarbageCollectionReason, v8::GCCallbackFlags) [node]
 7: 0xec404e v8::internal::Heap::AllocateRawWithRetryOrFailSlowPath(int, v8::internal::AllocationType, v8::internal::AllocationOrigin, v8::internal::AllocationAlignment) [node]
 8: 0xe8558a v8::internal::Factory::NewFillerObject(int, bool, v8::internal::AllocationType, v8::internal::AllocationOrigin) [node]
 9: 0x11fe2d6 v8::internal::Runtime_AllocateInYoungGeneration(int, unsigned long*, v8::internal::Isolate*) [node]
10: 0x15f2d39  [node]
Aborted (core dumped)
I have sourcemaps disabled.
Similarly, I'm experiencing OOM errors on my laptop when building (2.3 GHz Quad-Core Intel Core i7, 32GB RAM, macbook pro), or running my test suite.
I found that removing the many dedupe entries I had in vite.config.js worked around out of memory on build, so seems like those may take up an inordinate amount of memory.
I replaced them with pnpmfile.cjs redirects, which can also be done with simpler pnpm aliases in cases.
I managed to fix this issue. No 'node' workarounds really helped me.
- I disabled some sourcemaps for building and added manual chunks for libs that take a lot space
// vite.config.ts


const plugins = [
  react(),
  svgr({
    exportAsDefault: true,
  }),
  shimReactPdf(),
  friendlyTypeImports(),
  splitVendorChunkPlugin(),
];

if (process.argv.includes('--visualize')) {
  plugins.push(
    visualizer({
      title: 'Vite Visualizer',
      filename: './stats.html',
    }),
  );
}

// https://vitejs.dev/config/
export default defineConfig({
  plugins,
  publicDir: paths.publicFiles,
  root: paths.root,
  envDir: paths.root,
  build: {
    sourcemap: false,
    commonjsOptions: {
      sourceMap: false,
    },
    minify: true,
    rollupOptions: {
      output: {
        manualChunks: {
          editor: ['jodit'],
          reactPdf: ['react-pdf'],
          recharts: ['recharts'],
        },
      },
    },
  },
});
- I added lazy loading for a lot of components by route
const BlogPage = React.lazy(() => import('../pages/blog'));
const AboutPage = React.lazy(() => import('./pages/about'));
const ApiPage = React.lazy(() => import('./pages/api'));

const MainRoute = () => {
  return (
      <Switch>
        <Route path={paths.blog} component={BlogPage} />
        <Route exact path={paths.about} component={AboutPage} />
        <Route exact path={paths.api} component={ApiPage} />
      </Switch>
  );
};

export default MainRoute;
- Something more specific, but I replaced the 'react-file-viewer' lib with some custom solution
Although I don't have a direct solution, I can confirm the following:
- Sourcemaps are a major source for the problem. Memory spiking in our builds went from 7GB to 2GB when disabling sourcemaps.
- Code splitting via dynamic imports helped resolve the issue. This is, of course, not always possible.
rollup-plugin-visualizerhelped me decide the most profitable opportunities for code splitting. It helped illustrate which modules were the largest that had the least number of touchpoints.Utilizing
manualChunksmight help if you can manage it, although I haven't tested this yet.
Actually, the same actions helped me, as well, you can look at one message above 👆
I was building the app on ubuntu-linux (via github action runners). I got it solved by enabling the swap space on linux.
    - name: Set Swap Space
        if: matrix.os == 'ubuntu-latest'
        uses: pierotofy/set-swap-space@master
        with:
          swap-size-gb: 10