conduit
 conduit copied to clipboard
Performance issue with lifted version of `Control.Monad.Reader.local`?
There is a significant difference in time and space usage when running code that uses local in ConduitM _ _ (ReaderT r m) vs ReaderT r m.
Steps to reproduce:
- Clone https://github.com/sol/conduit-issue and build it with
-O0 - Run
reader +RTS -s -K1K -RTS plainfor reference and see it succeed - Run
reader +RTS -s -K1K -RTS conduitand see it fail
reader +RTS -hT -i0.05 -RTS conduit && hp2ps -c reader.hp && convert -rotate -90 reader.ps reader.png gives some insight into how memory is used:
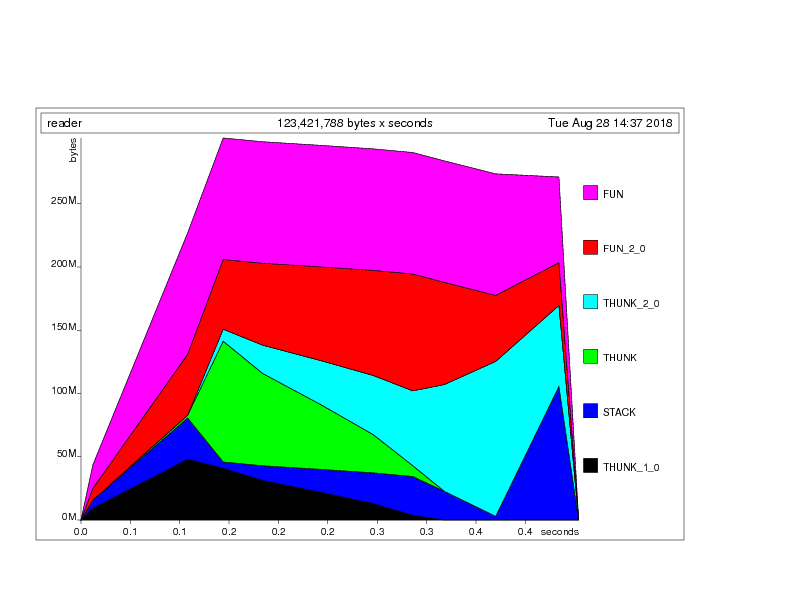
I discovered this while working on https://github.com/snoyberg/yaml/pull/148. I'm not sure whether this is something that is inherent or if it can be fixed.
I'm also not sure whether it's worth tackling at all.
It doesn't mean much to look at these stats with optimizations disabled. What happens if you turn on -O1?
With -O1 the program runs faster, this is why I changed the sampling interval to -i0.03:
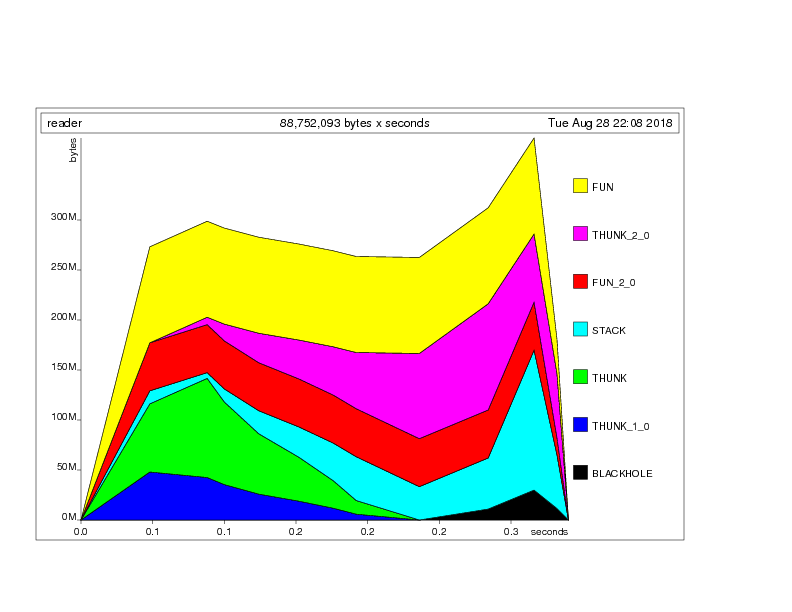
Still has the final spike in stack usage.
BTW, this is what I see if I change the final ask to return () (read: we never look at the reader value):

- memory usage, not stack usage.
I don't view that spike at the end as particularly significant - if you removed it you save 20% max memory? The green THUNK at the start is what I'd target, as it feels wrong - like a space leak, but perhaps not one of the ones that gets caught by the -K trick.
I don't view that spike at the end as particularly significant
Hmm, with spike I was really only referring to the spike in stack usage towards the end (the light blue segment in the -O1 case), which I assume is due evaluating that purple THUNK_2_0 thingy.
Stack usage peaks around 150M, which can also be confirmed with:
$ reader +RTS -s -K140M -RTS conduit -- fails
$ reader +RTS -s -K150M -RTS conduit -- succeeds
So my comment was really just about the symptom (high stack usage), rather than the underlying problem (thunking).
The green THUNK at the start is what I'd target, as it feels wrong
I will probably not have much time to dig much deeper into this. I'm also still not sure how relevant this whole thing is. Yes, it feels wrong and it had a measurable impact on how I used it in yaml. But, I don't know how efficient it can be made; and I don't know how much this matters in practice (how often do people actually do recursive calls to local)?
- What I do know is, the non-conduit version is much much more efficient, especially with
-O1 - This is the code that produces the thunks: https://github.com/snoyberg/conduit/blob/conduit-1.3.0.3/conduit/src/Data/Conduit/Internal/Conduit.hs#L163-L169
perhaps not one of the ones that gets caught by the
-Ktrick
I was naively assuming that it does. Stack usage seems to be in the couple of megabytes during the whole run of the program. Or do you mean that the high stack usage is not related to thunk evaluation, but something else?
Call you try liberally sprinkling INLINEs to the typeclass instances?
On Tue, Aug 28, 2018, 6:52 PM Simon Hengel [email protected] wrote:
I don't view that spike at the end as particularly significant
Hmm, with spike I was really only referring to the spike in stack usage towards the end (the light blue segment in the -O1 case), which I assume is due evaluating that purple THUNK_2_0 thingy.
Stack usage peaks around 150M, which can also be confirmed with:
$ reader +RTS -s -K140M -RTS conduit -- fails $ reader +RTS -s -K150M -RTS conduit -- succeeds
So my comment was really just about the symptom (high stack usage), rather than the underlying problem (thunking).
The green THUNK at the start is what I'd target, as it feels wrong
I will probably not have much time to dig much deeper into this. I'm also not sure how relevant this whole thing is. Yes, it feels wrong and it had a measurable impact on how I used it in yaml. But, I don't know how efficient it can be made; and I don't know how much this matters in practice (how often do people actually do recursive calls to local)?
- What I do know is, the non-conduit version is much much more efficient
- This is the code that produces the thunks: https://github.com/snoyberg/conduit/blob/conduit-1.3.0.3/conduit/src/Data/Conduit/Internal/Conduit.hs#L163-L169
perhaps not one of the ones that gets caught by the -K trick
I was naively assuming that it does. Stack usage seems to be in the couple of megabytes during the whole run of the program. Or do you mean that the high stack usage is not related to thunk evaluation, but something else?
— You are receiving this because you commented. Reply to this email directly, view it on GitHub https://github.com/snoyberg/conduit/issues/388#issuecomment-416638719, or mute the thread https://github.com/notifications/unsubscribe-auth/AADBB26yMw5V2SbJDLEouAG4m55lRl_dks5uVWdUgaJpZM4WPJNo .
Stack usage of 150Mb is really nuts. Afraid I have no idea what's going on though...