prom-client
 prom-client copied to clipboard
Best way to do total count in case of counter reset ?
I am using prometheus + grafana, and wrote a simple query like sum(increase(some_count[$__range])) , although this takes the difference between the first and last values, seeing prometheus values gets restart on restart of our node server, any better approach to tackle this problem ? Sample graph explaining the drop due to server restart

Seems like a prometheus question, not prom-client. Have you googled around?
https://groups.google.com/forum/#!topic/prometheus-developers/JaSY73UQv70
https://www.robustperception.io/rate-then-sum-never-sum-then-rate
both seem a bit relevant.
Maybe use rate()? Its robust to counter resets.
Yes read a lot but couldn't find the exact solution, using rate is also similar to increase will give the same graph
This comes up a lot and unfortunately it's not something that can really be handled in this library. Using push-gateway is an option but requires some additional setup. (It'd probably be worth while to write up an example of this by now.)
rate/irate as sam-github suggested is also a fairly good solution if you can ignore the spikes.
@brian-brazil do you have any input how to handle this sort of issue (persisting metric resets either when an app thread [cluster worker] crashes and respawns, or when the app itself restarts)? From what I understand, any improvement we could make in this library would run counter to the stateless design guidelines for Prometheus clients. This issue comes up a lot though and push-gateway feels like a cumbersome solution.
See also #207, #385.
If a process dies it's normal for counters reset, let rate worry about it. Don't try to persist counters across runs of an application.
I don't see the link to the pushgateway.
Thanks!
pushgateway came up as a possible way to persist counters, e.g. by pushing metrics in an app shutdown hook. I totally understand the desire to persist counters -- if the metric doesn't lend itself to a rate (e.g. total page views), then the resets are problematic.
if the metric doesn't lend itself to a rate (e.g. total page views), then the resets are problematic.
That's a counter, so rate should work fine.
Hm, I'm missing something then. Getting the total number of page views [since some date] from a rate requires taking the integral, right? Do Prometheus or Grafana have that capability? That also seems like it would require setting your Prometheus retention period to "forever".
Getting the total number of page views [since some date] from a rate requires taking the integral, right? Do Prometheus or Grafana have that capability?
Yes, that's what rate() does basically.
That also seems like it would require setting your Prometheus retention period to "forever".
That's a bit of a different use case, and out of scope for Prometheus. If you want a perfect count of how many times something has happened ever, logs are usually the appropriate solution. Prometheus works over arbitrary time periods of a specified duration, not unbounded time periods.
@somyarocketium
With prometheus + grafana I believe you can get the grand total of all increase in the current window by using the legend.
You can do something like this
Query:
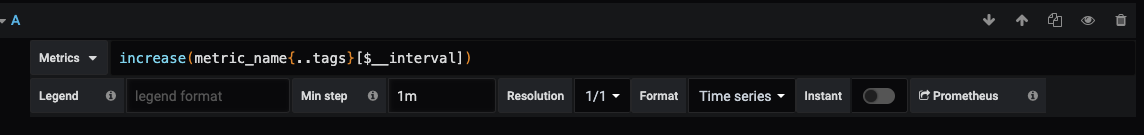 Setting $__interval will automatically use the minimum x-axis time unit based on your window resolution. $__interval is an auto scaling feature you can use with prometheus + grafana. Make sure to also set min step to 1m.
Visualization > Legend
 The total that is reflected in the legend will be the total increase that happened in your window. This should work regardless if a counter reset happened
Result:

Just to leave this here:
sum by (label) (increase(metric[$__range]))
Is what I was looking for when I came here via search.