plotly.js
 plotly.js copied to clipboard
Offload chart initalization to web workers
Has it been explored if CPU-intensive tasks like chart initialization can be offloaded to web worker threads?
For example, when I initialize around 20 charts at the same time, I observe a 5 second freeze of the current browser window in Firefox. During this period, I don't see anything drawn to the DOM, so I assume the code that runs could potentially be offloaded to a worker thread, which could then communicate the resulting SVG to the main thread.
I think a change like this could be a great win in terms of user experience.
Also, have a related StackOverflow question.
Hello, I am also interested in a solution to this to be able to render many graphs without freezing the UI. Did you come up with a solution?
I am interested in a workaround.
Hello, I'm the creator of the SO post. I'm still interested in an elegant solution.
Also very looking forward for something like this. Displaying >30 plots on a single page really takes a toll on the user's patience =(
@silverwind Several operations are happening synchronously so there will be no repaint until it's all done. This is why you're not seeing anything drawn to the DOM upon chart initialization. Unfortunately, several CPU-intensive tasks depend on having a DOM so they currently can't be moved to Web Workers :\
In order to improve user experience, do not initialize all the plots at the same time but rather in a chain of promises. This way, they will render in order so you can draw the top ones first. After each graph is completed, you could also update a progress bar to notify the user that the page is working!
In the rare cases where one doesn't need interactivity, it is possible to pre-render the figures server-side using the REST API at https://api.plot.ly/ or with Orca.
Example:
// POST https://api.plot.ly/v2/images/ --> 200 OK
{
    "figure": {
        "data": [{"y": [10, 10, 2, 20]}],
        "layout": {"width": 700}
    },
    "width": 1000,
    "height": 500,
    "format": "svg",
    "scale": 4,
    "encoded": true
}
We understand those are not perfect solutions so we'll be keeping an eye on Web Worker's developments. BTW, thank you for the great suggestion!
For my use case I bound the drawing on a combination of scroll event and viewport visibility check (that only fires once). Won't help for something like a dashboard, where you see everything at one glance, though.
So this "workaround" works pretty good on everything I've tested yet, only Chrome on android still makes a scene. When I scroll over a div that renders a plot the browser jumps to the top of the page.
Here's a snippet for anyone who wants to reproduce this behaviour, you'd need jQuery, jQuery visible plugin and underscore.js
jQuery(function ($) {
    $(window).scroll(_.throttle(function () {
        if($("#plotid").visible(true) && !$("#plotid").hasClass("js-plotly-plot")) {
            //Draw your plot here
        }
    },100));
});
Anyone got an idea why Chrome mobile is acting up? What could lead the browser to jump to the top of the page?
Any news for Web workers?
Wrapping the call to Plotly.newPlot in a setTimeout helps mitigate this issue for me.
It might make the UI a bit smoother but the main problem at least for me is that rendering 10 and more charts takes too long. That's why using multi threading (web workers) looks like a solution. It would be absolutely fantastic to render 10 charts for a time of one!
I responded to this a long time ago on another account whilst I was using plotly extensively, and periodically receive updates about it. During that time, I've intermittently investigated this matter for real time dashboards with a lot of data mutations, and found two possible solutions:
-
Use jsdom to provide a virtual DOM for D3 to consume, then (if possible) serialise the contents as a string and send it back to the main thread for injection. You offload the heavy calculations to the worker and use the main thread to render. It might help.
-
Use another library or create your own proprietary solution. This would probably give you the greatest performance as you're no longer passing large objects between the worker and the main thread, nor having it blocked from rendering.
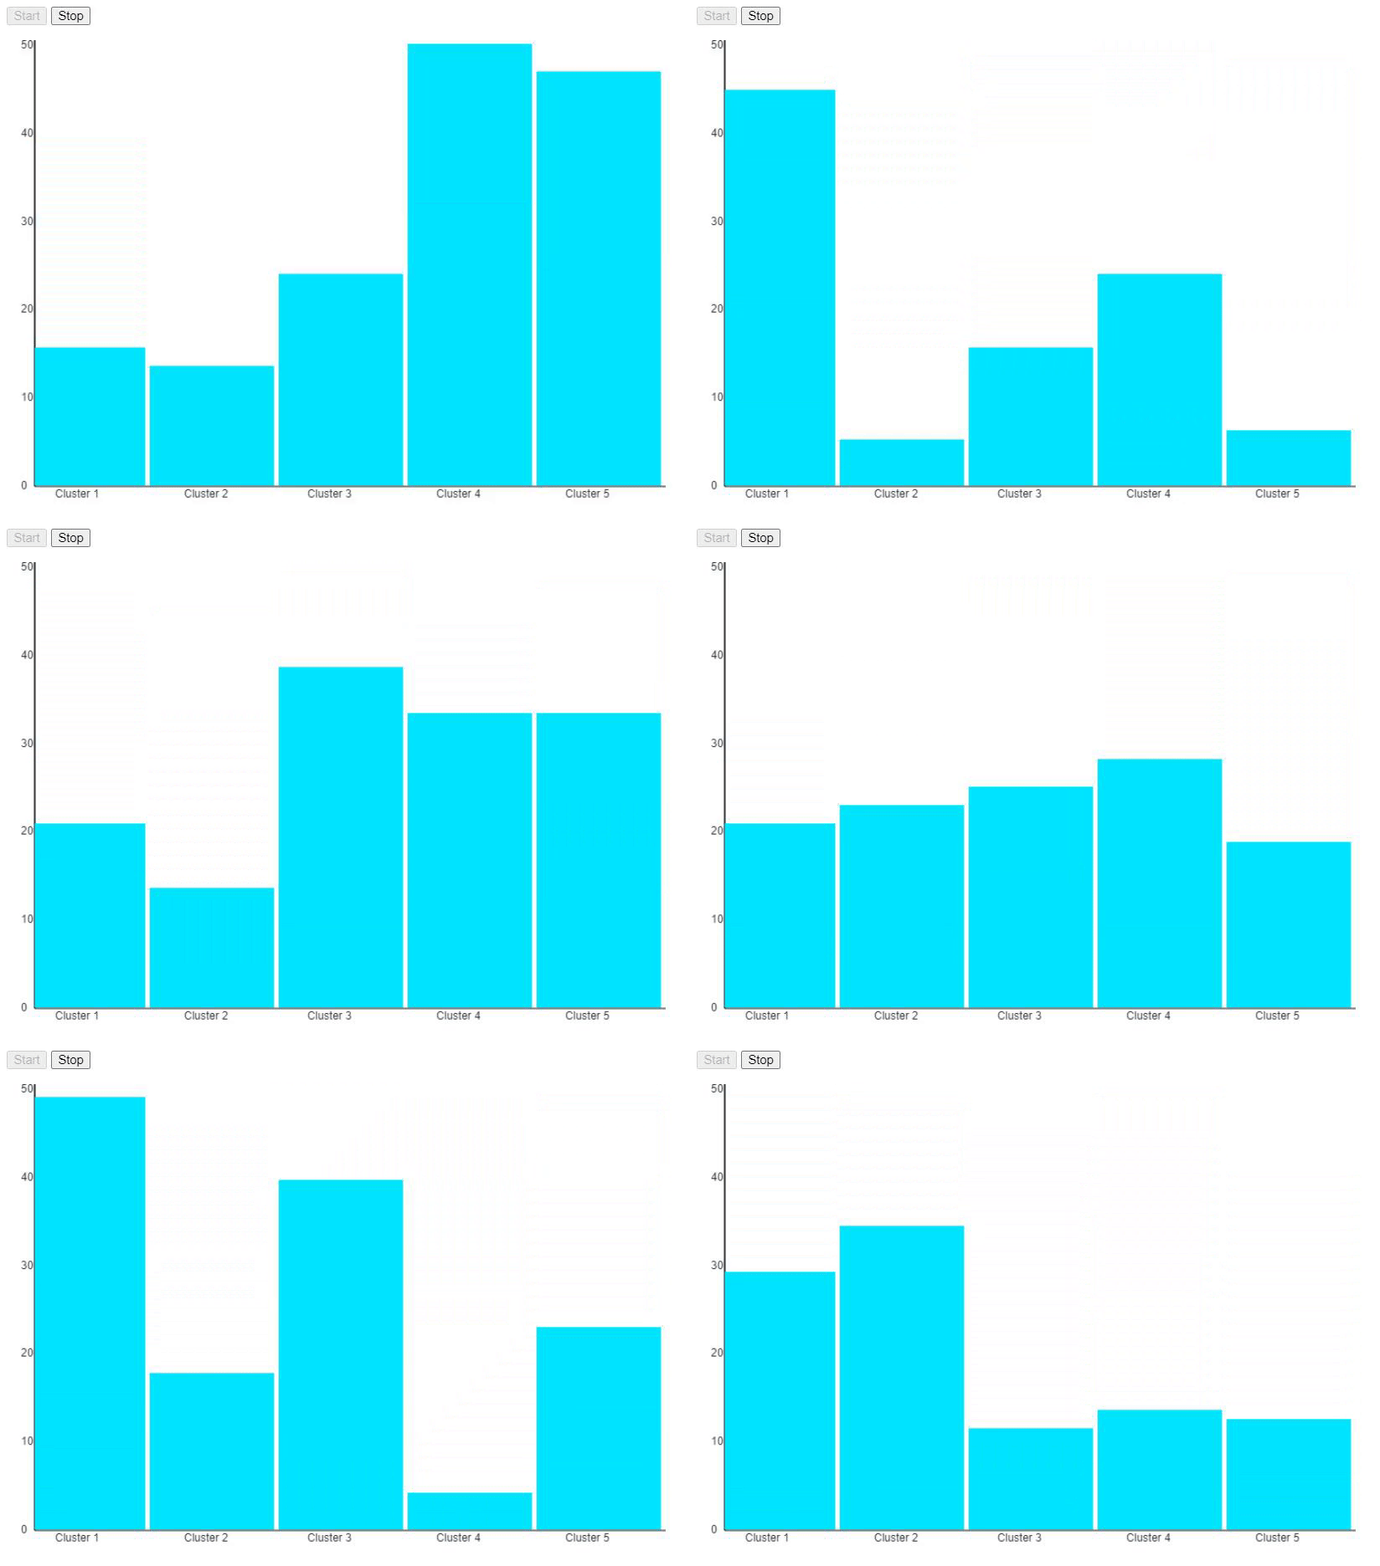
Here's an example I made using OffscreenCanvas API.
I'm interested this feature, in my plots over 15kk values at the same time. I have a bad performance on zooming or moving.
I'm interested this feature, in my plots over 15kk values at the same time. I have a bad performance on zooming or moving.
This is quite a different matter probably need to use WebGL plot types https://plotly.com/python/webgl-vs-svg/
Any update on this issue ? My thinking is to at least allow Plotly to generate the data without applying it to the DOM. Then it can be offloaded to webworker and afterwards apply the result to the DOM. I don't see such a function
My thinking is to at least allow Plotly to generate the data without applying it to the DOM. Then it can be offloaded to webworker and afterwards apply the result to the DOM. I don't see such a function
OffscreenCanvas indeed looks like the ideal solution for something like this. It's not even experimental anymore and almost 90% of user's browsers support this feature by now.
The problem I see with the current implementation in Plotly is that it expects a div element and doesn't actually use canvas elements, at least not without WebGL AFAIK.
