ClearScript
 ClearScript copied to clipboard
Cannot debug JS code built from TypeScript in VSCode
Hello. Thank you for providing this awesome library!
I'm currently using ClearScript v.7.2.0 and trying to debug JavaScript built from TypeScript.
I'm using esbuild v0.14.24 as a bundler, and setting sourcemap option to inline.
My problem is that, when I press F5 in VSCode, it shows a tab labeled Script[temp] and cannot refer TypeScript file.
Anyway to resolve this problem?
Hi @Hayao-H,
Thank you for your kind words!
My problem is that, when I press F5 in VSCode, it shows a tab labeled Script[temp] and cannot refer TypeScript file. Anyway to resolve this problem?
Can you provide more information? Specifically:
- How does your .NET host load and execute the code?
- What does the inline source map look like? Is it just a data URL?
- What kind of workspace are you loading into VSCode?
- What does your VSCode debugger configuration look like?
Thanks!
Thanks for reply.
How does your .NET host load and execute the code?
I use Clear Script like below:
using var reader = new StreamReader(jsfilePath);
string code = reader.ReadToEnd();
var engine = new V8ScriptEngine(V8ScriptEngineFlags.EnableTaskPromiseConversion | V8ScriptEngineFlags.EnableDateTimeConversion | V8ScriptEngineFlags.EnableDebugging | V8ScriptEngineFlags.AwaitDebuggerAndPauseOnStart);
engine.Evaluate(code);
What does the inline source map look like? Is it just a data URL?
Yes. It look like this: //# sourceMappingURL=<Data_URIs>.
And this is written in bottom of the JS file.
What kind of workspace are you loading into VSCode?
I'm sorry, I can't understand what kind of workspace means.
What does your VSCode debugger configuration look like?
It looks like this:
{
    "version": "0.2.0",
    "configurations": [
        {
            "name": "JavaScript System Debug",
            "request": "attach",
            "protocol": "inspector",
            "address": "localhost",
            "port": 9222,
            "type": "node"
        },
    ],
}
Hi @Hayao-H.
Thanks for providing additional information.
We used esbuild to compile a trivial TypeScript application, generating JavaScript with an inline source map.
When we executed the result in ClearScript using the V8ScriptEngineFlags.AwaitDebuggerAndPauseOnStart option, VSCode ignored the source map, just as you reported. We also tried Node.js with the --inspect-brk option and observed the same result.
Finally, we repeated the test using the Chrome/Edge debuggers, and the source map worked perfectly for both ClearScript and Node.js. Therefore, we believe this is a VSCode issue, and we reported it here.
Thanks again!
According to the VSCode team, this scenario represents a feature request rather than a bug.
Thanks for your efforts! By the way, when VS Code team implements that feature, will you enable debugging of Type Script running on Clear Script? Thanks.
By the way, when VS Code team implements that feature, will you enable debugging of Type Script running on Clear Script?
Our understanding is that it should start working automatically once you install the relevant VSCode update. Note that ClearScript doesn't have to do anything special to enable inline source maps in the Chrome and Edge debuggers.
Our understanding is that it should start working automatically once you install the relevant VSCode update. Note that ClearScript doesn't have to do anything special to enable inline source maps in the Chrome and Edge debuggers.
Oh, I'm sorry. Now, I have understood. Thank you.
Please reopen this issue if you have additional questions or findings related to this topic. Thank you!
@ClearScriptLib could you please add here a minimal snippet on how you setup V8ScriptEngine, so that a bundle with inline source map could be debugged in Chrome, thanks!
If simply running the following:
var code = "console.log(\"Hello, world!\");\r\nconsole.log(\"Hello again, world!\");\r\n//# sourceMappingURL=data:application/json;base64,ewogICJ2ZXJzaW9uIjogMywKICAic291cmNlcyI6IFsiYXBwLnRzIl0sCiAgInNvdXJjZXNDb250ZW50IjogWyJ0eXBlIEJvZ3VzID0gTWF0aDsgLy8gdGhpcyBpcyBhIFR5cGVTY3JpcHQgZmlsZVxyXG5jb25zb2xlLmxvZygnSGVsbG8sIHdvcmxkIScpO1xyXG5jb25zb2xlLmxvZygnSGVsbG8gYWdhaW4sIHdvcmxkIScpO1xyXG4iXSwKICAibWFwcGluZ3MiOiAiQUFDQSxRQUFRLElBQUk7QUFDWixRQUFRLElBQUk7IiwKICAibmFtZXMiOiBbXQp9Cg==";
var engine = new V8ScriptEngine(V8ScriptEngineFlags.EnableDebugging | V8ScriptEngineFlags.AwaitDebuggerAndPauseOnStart);
engine.Evaluate(code);
Then the sourcemap is not loaded in Chrome Node DevTools debugger.
Hi @iotalambda,
The sample you posted works perfectly in our testing. Here's a DevTools screenshot just after initial connection:
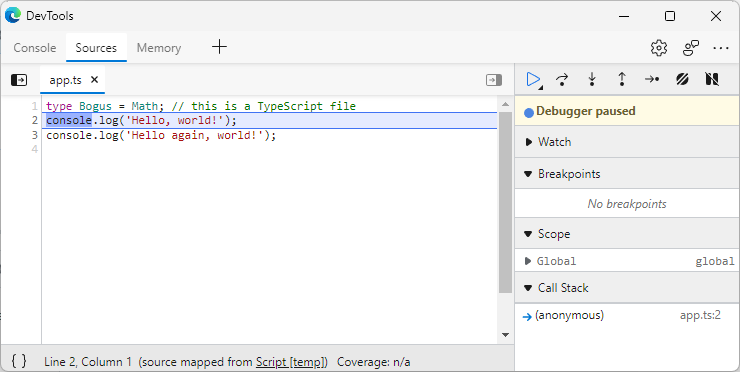
If you're seeing something different, please let us know.
Thanks!
Hey @ClearScriptLib ! It indeed seems that Edge DevTools works perfectly, which is great! I wonder why Chrome (at the moment latest version 107.0.5304.121) DevTools seems to be unable to load the sourcemap...

Additional note: If I save the js to a file and then run node --inspect-brk file.js, then the sourcemap is loaded properly in Chrome DevTools as well.